Overview
This tutorial leads you step-by-step through a simple CVA (Conjoint Value Analysis) study, from thinking about a marketing problem, planning a questionnaire and creating a new CVA study, to entering a list of the attributes and levels, generating the questionnaire and analyzing the results.
CVA is a powerful program, and this tutorial only touches on the basics. You'll become aware of different or more sophisticated approaches by studying other sections within this on-line help and by experimenting with the CVA System.
(Note: this example and the data presented are purely fictional. The suggested steps represent one approach to this type of marketing problem, but may not necessarily reflect the single "best" way to conduct such a research study using the CVA system. This tutorial only uses 3 attributes, to keep things simple.)
The Marketing Problem
Over the last five years, the Wendell State University football program has risen to prominence on the national scene. As a graduate of this prestigious university and a rabid football fan, you have reveled in the success. Wendell State's football coach, Biff Brierton, has developed arguably the best defensive line in the nation, three years running. It is nearly impossible anymore to buy tickets as the somewhat undersized stadium sells out early.
While you are perusing the media guide for this year's team, the phone rings. It is your former marketing professor, Dr. Coldridge. You've kept in contact with her over the last few years as you've built your small strategic consulting practice. It seems Dr. Coldridge also has your favorite subject (Wendell State football) on her mind.
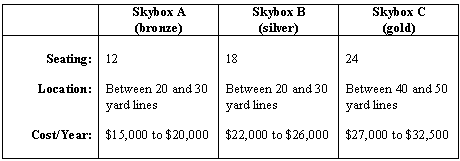
The administration at Wendell State has been looking for ways to capitalize on the football team's newfound success. One plan is to add a second tier to the East side of the stadium with additional seating and between 25 to 35 luxury skyboxes. Each skybox would be an enclosed suite, seating from 12 to 24 people, depending on the size. The glass front of each climate-controlled skybox would provide an excellent view of the playing field.
Dr. Coldridge explains that an initial study has already been completed that showed a high level of interest among key alumni and corporate customers for the skybox concept at Wendell State stadium. But further questions remain regarding how to design the skyboxes and the price premium to charge for boxes nearer the center of the field. Knowing how often you apply conjoint analysis within your practice, Dr. Coldridge asks if you are interested in assisting her with a follow-up study. You, of course, agree.
The following week, Dr. Coldridge visits your office. Always well organized, she has brought a list of objectives for the research:
1) What is the relative demand for 12-seat, 18-seat, and 24-seat skyboxes? (The planners need to know how many to build of each size)
2) How much price premium should be charged for skyboxes near the center of the stadium (on the 40- or 50-yard lines) versus those near the sides (near the 20- to 30-yard lines)?
You have a limited sample frame to work with: just 180 names of key supporters who have the economic means to buy skyboxes. Based on your past experience, you think that you may achieve a response rate of around 25 to 50%. This would yield between 45 and 90 respondents.
Given the relatively small sample size, the limited number of attributes to study, and the objectives of pricing research, you decide to use traditional full-profile conjoint analysis. The sponsors of the study understand that the relatively small sample size will lead to good directional information, but the findings will be accompanied by a relatively large margin of error. Because you are dealing with rating scales, you cannot know the standard errors ahead of time, because you cannot predict the standard deviation of the ratings. This is different from common opinion polls that measure proportions (i.e. the percent projected to vote for candidate A or B) where there are well-known formulas for estimating the standard errors of proportions given different sample sizes.
Defining a List of Attributes and Levels
The next step for you and Dr. Coldridge is to formulate some attributes and levels. You suggest that she ask the planners to specify some preliminary scenarios (an array of competitive skybox configurations/features) to measure. These scenarios in the language of the CVA software will form a base case, or variations from the base case, to be used in the market simulator.
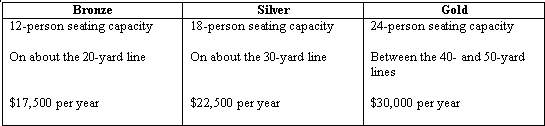
The next week, Dr. Coldridge returns with three principal configurations the planners are considering. She stresses that there can be some variations on the three themes (mixing and matching different costs and field locations) but that these specifications definitely cover the full range of options that the planners want to measure.
Satisfied with the progress so far, you both decide to formulate a list of attributes and levels. Based on the information in the CVA documentation, you review the following list of ground rules with Dr. Coldridge.
1. Attributes should be as close to independent of one another as reasonably possible. CVA (like most conjoint techniques) assumes a simple additive model and violations of simple additivity within CVA are nearly impossible to detect.
2. Because attributes are independent of one another, the levels across all attributes should be able to combine freely.
3. Levels within each attribute must be mutually exclusive. Skyboxes are described using a single level from each attribute.
Most conjoint analysis projects involve no more than about five levels per attribute. There is rarely a need to measure more than about five levels of an ordered attribute, you explain, as our market simulators let you interpolate between measured levels during analysis. Including too many levels for an attribute significantly lowers the precision of the utility estimates for each level. It also can lead to a problem in conjoint analysis called the "Number of Levels" effect. Attributes defined on relatively more levels tend to get an artificial boost upward in importance.
Using the white board in your office, you begin working on a preliminary list. First you write down the three seating capacities. Because each level must communicate fully the meaning of the attribute, you add some additional wording.
Seating
12-person seating capacity
18-person seating capacity
24-person seating capacity
Next, you turn to the location of the skybox. You note that there are only two variations available in the base case scenario provided by the planners. Because you want to roughly balance the number of levels across attributes, you decide to treat this also as a three-level attribute.
Location
On about the 20-yard line
On about the 30-yard line
Between the 40- and 50-yard lines
Finally, the issue of pricing: You don't like the fact that the prices are described in terms of ranges (e.g. $15,000 to $20,000 for the least expensive options). This leaves too much interpretation up to the respondent. Do we mean $15,000 or do we mean $20,000? You suggest that each level be defined at a specific price, but that you cover the full range of possible prices to be studied:
Price
$15,000 per year
$22,500 per year
$32,500 per year
You next figure how many conjoint questions you would need to ask to achieve reasonably stable estimates for each individual. The total number of parameters to estimate is equal to:
Total Number of Levels - Total Number of Attributes + 1
For this list (9 total levels and 3 attributes), the number of parameters to estimate is 9-3+1=7. CVA software suggests asking three times as many questions as parameters to estimate. This would imply 21 questions. You both decide this is a reasonable task.
But then Dr. Coldridge gets a concerned look on her face. She suggests that some of the combinations don't seem to make much sense. It seems hard to believe that a skybox on the 50-yard line would be available for just $15,000 per year, or that skyboxes on the 20 yard line would go for $32,500.
You both agree that ideally you'd like to avoid all prohibitions in this design. Given the small sample size, you need to have as efficient plan as possible for estimating stable part-worths. You decide to investigate the damage these prohibitions might do to the efficiency of the design using the CVA experimental design program. If the reduction in design efficiency is only slight, then a modest prohibition or two may be well worth achieving more realistic product profiles and some added utility balance in the design (by avoiding dominated alternatives).
A Sample Scripted Questionnaire
A few days later, you receive an E-mail from Dr. Coldridge She has scripted some expanded attribute definitions and a few additional questions to ask study participants. You put that together with some text you usually use for CVA studies, creating a unified document:
Start:
Thank you for agreeing to participate in this study! We are asking prominent supporters of the Wendell State football program to give us their opinions regarding a new expansion project to the existing football stadium.
The expansion will involve additional seating, including about 25 to 30 luxury skybox suites. These luxury suites offer premier views of the playing field, catering, and air-conditioned comfort. Skyboxes range in size from 12-seat to 24-seat suites and cost from $15,000 to $32,500 per year to lease (usually 6 or 7 home football games).
Click the Next button below to continue...
Attendance:
Thinking about last year's season, how often did you attend home football games at Wendell State stadium?
m Every home game
m Most every home game
m Some home games
m No home games
IntroCVA1:
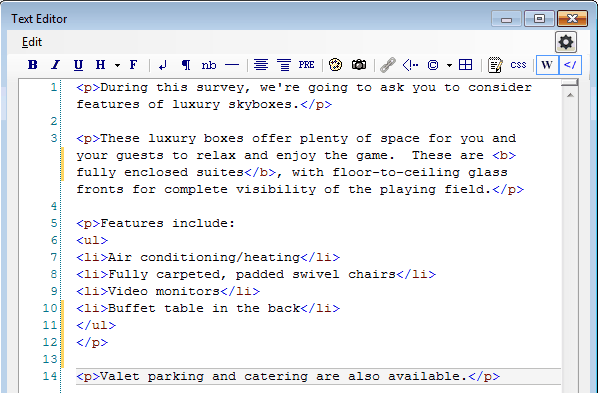
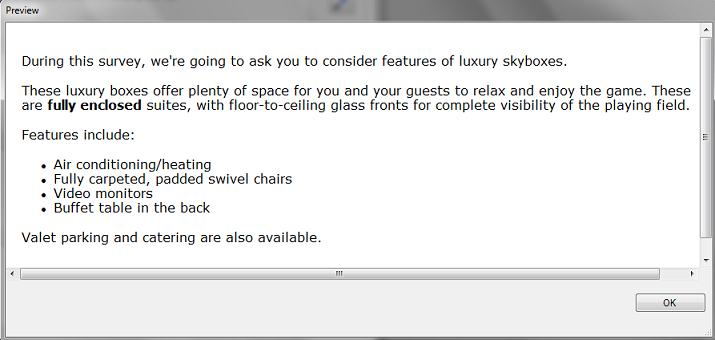
During this survey, we're going to ask you to consider features of luxury skyboxes.
These luxury boxes offer plenty of space for you and your guests to relax and enjoy the game. These are fully enclosed suites, with floor-to-ceiling glass fronts for complete visibility of the playing field.
Features include:
•Air conditioning/heating
•Fully carpeted, padded swivel chairs
•Video monitors
•Buffet table in the back
Valet parking and catering are also available.
IntroCVA2:
The skyboxes might differ in terms of:
Seating Capacity: 12, 18, or 24-person seating capacity
Location: On about the 20-yard line, on about the 30-yard line, or between the 40- and 50-yard lines
Cost per Year: between $15,000 to $32,500 per year. Minimum lease 2 years.
IntroCVA3:
Based on these features, we'd like you to compare different options for skyboxes. In each comparison, one skybox will be on the left, and another on the right.
Each skybox option will have slightly different features. In each case, we'd like to know which one you prefer. We'll ask you a number of these tradeoff questions so that we can learn what features of skyboxes affect your opinions and preferences.
CVA Conjoint Pairs Task (21 of these questions)
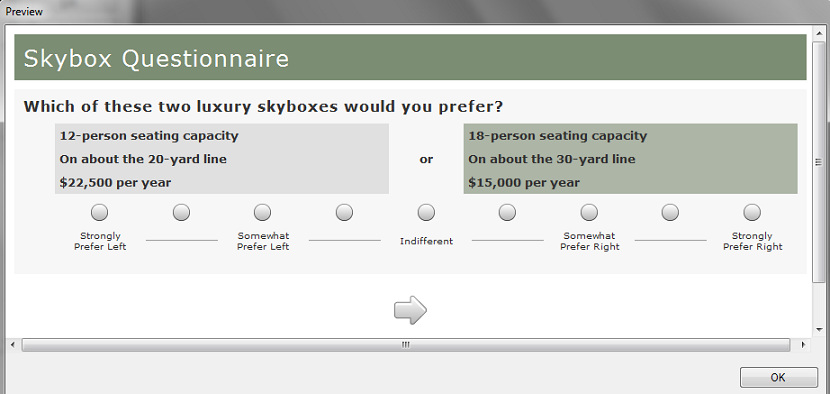
Which of these two luxury skyboxes would you prefer?
<Show skybox on left> or <Show skybox on right>
Respondents are asked to choose between different skyboxes, using a 9-point sliding scale. By varying the skybox profiles and observing the respondent's preferences, we are able to determine the preferences respondents have for the different features of the skybox. Respondents will answer 21 of these questions.
Interest:
During this survey, you have had a chance to trade off different options for luxury skyboxes. We now would like you to consider just this one luxury skybox:
18-person seating capacity
On about the 30-yard line
$22,500 per year
How likely would you actually be to purchase this luxury skybox (2-year lease) if it was available for the next season?
m Extremely likely
m Very likely
m Somewhat likely
m Not very likely
m Not at all likely
Holdout:
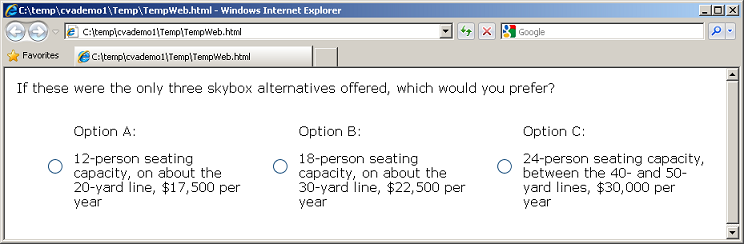
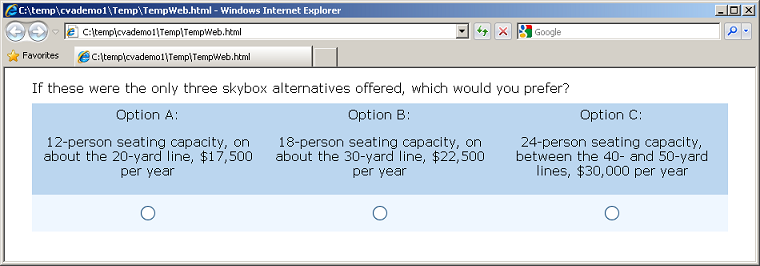
If these were the only three skybox alternatives offered, which would you prefer? |
||
Option A:
12-person seating capacity, on about the 20-yard line, $17,500 per year |
Option B:
18-person seating capacity, on about the 30-yard line, $22,500 per year |
Option C:
24-person seating capacity, between the 40- and 50-yard lines, $30,000 per year |
For the sake of brevity, we have only included one holdout choice task. In an actual CVA study, you would probably want to include at least three or four different holdout choice tasks.
Finish:
That completes our survey. Thank you very much for your input.
Using Lighthouse Studio to Write the Questionnaire
Start by opening Sawtooth Software Lighthouse Studio. If you have a standard installation, you start it by clicking Start | Programs | Sawtooth Software | Sawtooth Software Lighthouse. CVA is one component within that software program. The next step is to open a new study, and define a study name.
After starting Lighthouse Studio, choose File | New Study…. The New Lighthouse Study dialog appears, with your cursor active in the Name field.

The Location field lists the folder (directory) that Lighthouse Studio currently is using to store studies. You can use any folder you like for this tutorial project. You can browse to and create new folders by clicking the Browse... button to the right of the Location field, and then (after browsing to the folder in which you want to create a new sub-folder to contain this study) by clicking the "new folder" icon. Each studyname has a maximum number of twenty-four characters (either letters or numbers), and must be located within its own folder. The folder that Lighthouse Studio automatically creates for your study also carries the same twenty-four character name as the study. For this tutorial, you might create a name such as cvademo1. From the New Lighthouse Study dialog, specify cvademo1 as the studyname.
Click the OK button. You are returned to the main menu, and a new "Study Navigator" window is displayed along the left-hand side of the screen.
As you work with this study, items appear in the Study Navigator window, listing the functional areas you have been using or that are now available to you. This list of items provides a Shortcut link to access those parts of Lighthouse Studio. Alternatively, you can access those same areas by clicking icon buttons on the toolbar or by using the pull-down menus.
Now that we have created a study called cvademo1, we can add our CVA exercise to that study. Click Compose | Write Questionnaire... to access the Write Questionnaire dialog. Place your cursor at the place in the questionnaire when you'd like to add the CVA exercise. Right now, there are no questions in your survey, so you can just click the last page break in the questionnaire list, and click the Add... button.
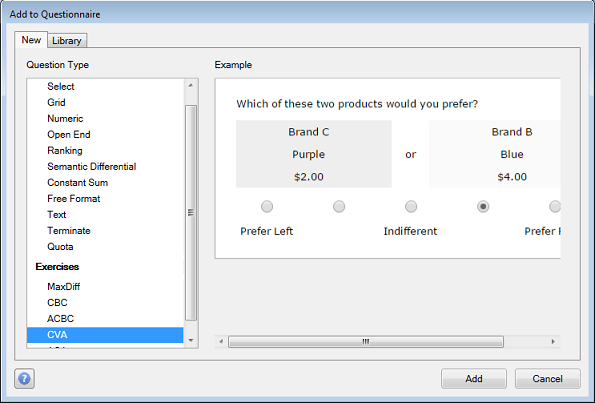
Specify to add a new CVA exercise to the study (you can have multiple CVA exercises within the same study). Click Add and specify an exercise name of CVAskybox. Click OK, and the CVA Exercise Settings dialog is shown.
Entering the List of Attributes and Levels
When composing conjoint analysis studies, one typically begins by specifying the list of attributes and levels in the software.
To enter the list of attributes and levels you developed, go to the Attributes tab on the CVA Exercise Settings dialog.
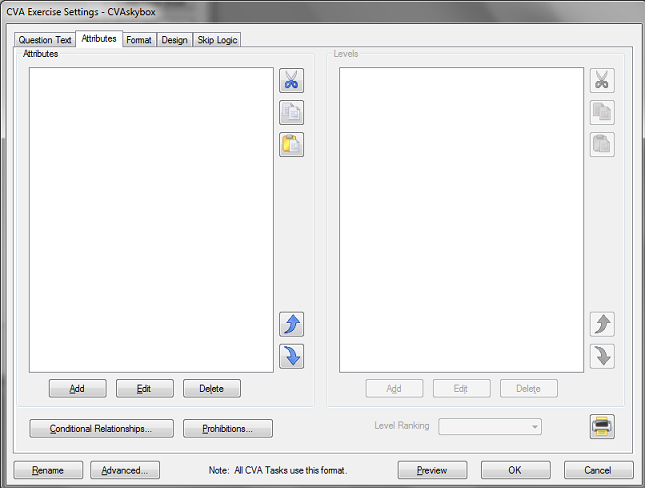
To add the first attribute, click the Add button (at the bottom left of the Attributes panel).
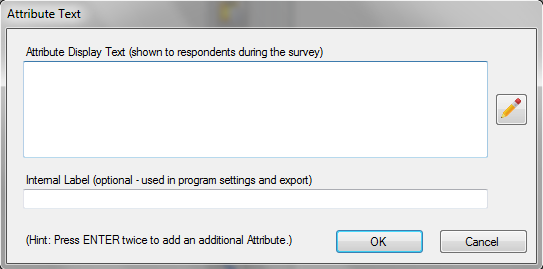
Type in the first attribute name: Seating. The attribute name is a label that the respondent may see in the interview (if you select the option to show the attribute labels at the left of each choice task). If you want to use a shorter label to display to you as the questionnaire author for program settings and data export, specify that label in the Internal Label field. If you do not specify an internal label, the label in the Attribute Display Text is used. Click OK to accept this information and close the dialog. Now that at least one attribute name is in the list, the Add button under the Levels panel becomes active. Also note that the Seating attribute is highlighted in the Attributes panel. With the Seating attribute highlighted in the Attributes panel, click the Add button under the Levels panel to add levels within the Seating attribute. The Level Text dialog is displayed. Type 12-person seating capacity in the Level Display Text field. To add the next level of Seating, press the ENTER key twice. Type in the next level: 18-person seating capacity. Repeat the process for the last level of seating (24-person seating capacity).
When you are ready to add the next attribute (Location), click the Add button under the left Attributes panel, type the attribute label, and click OK to place that new attribute on the attribute list. With that new attribute highlighted on the attributes list, click the Add button under the Levels panel to add the three levels of that attribute.
Follow the same pattern for the last attribute, Price. For your convenience, we repeat the full list of attributes below. Note that you can copy-and-paste attribute level text from this document (and other text documents) into the text fields. After highlighting the words to copy with your mouse, use the shortcuts Ctrl-C to copy, and Ctrl-V to paste into the desired field. (Hint: you can select a list of attributes or levels from Word and paste into Lighthouse using the Paste list member(s) from the clipboard icon![]() . This can save a great deal of time.)
. This can save a great deal of time.)
Seating
12-person seating capacity
18-person seating capacity
24-person seating capacity
Location
On about the 20-yard line
On about the 30-yard line
Between the 40- and 50-yard lines
Price
$15,000 per year
$22,500 per year
$32,500 per year
Make sure to specify a Worst to Best ranking for Location, and a Best to Worst ranking for Price. On the Attribute Specification dialog, there is a drop-down box at the bottom of the dialog for specifying the Level Ranking. You should pre-specify the ranking for any attributes with rational order of preference.
Generating the CVA Questions
After you have specified the list of attributes and levels, you are ready to generate the CVA questions. You use CVA's designer to create the combinations of products to show in the questionnaire. The combination of features that make up the conjoint questions across all conjoint questions in your study is collectively called the experimental design.
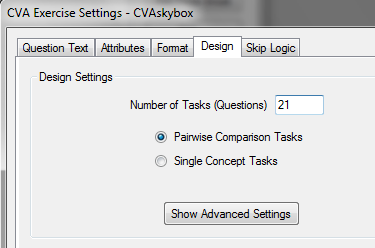
To generate the CVA questions, go to the Design tab of the CVA Exercise Settings dialog:
If you are uncertain regarding the different settings available and decisions to make about your CVA study, the default settings are ones that seem to work well in practice. We recommend you press F1 (help) if you have questions about any of the controls on any of these tabs. Context-sensitive help will appear when you press F1 to help you understand what each setting does. In many cases, advice regarding different settings is given.
Let's first turn to the Design tab. For the CVAskybox study, we have decided to use the default number of suggested questions (21) and Pairwise Comparison Tasks. We'll use the default settings to generate an experimental design. We'll assume that we will be interviewing online so that the software can easily manage multiple versions of the questionnaire. By default, CVA will create 10 different versions of the questionnaire (if you were interviewing via paper-and-pencil, you probably wouldn't want to manage so many different versions of the questionnaire). Each questionnaire version will have strong enough characteristics to stand on its own to provide enough information to lead to precise utility estimates for each respondent. But, having more than one version of the questionnaire will additionally control psychological order and context effects.
The process of creating the conjoint questions for each version of the questionnaire is as follows:
1. CVA generates a candidate pool of questions much larger than the number of questions you intend to use.
2. CVA searches within the candidate set for the most nearly optimal subset to use (according to the number of questions you've requested) to estimate part-worths with a high degree of precision. The search uses the criterion of D-optimality.
3. The search process is repeated multiple times, and the best result retained.
4. Steps 1 through 3 are repeated for each additional questionnaire version.
By default, CVA uses a random seed to begin the search process. By default, we will use a "1" as the Random seed (you can review this by clicking the Show Advanced Settings button to view the advanced settings).
We are now ready to generate the conjoint questions for each of 10 versions of the questionnaire (the experimental design). From the CVA Design tab, click Generate Design.
After a short period of computation, a report is shown. Your cursor is automatically positioned at the top of the report, which displays the summary of the results for the different questionnaire versions:
The top 10 version D-Efficiencies:
Pass D-Efficiency
9 0.99740
40 0.99740
74 0.99740
98 0.99740
67 0.99740
29 0.99739
30 0.99707
68 0.99674
7 0.99674
88 0.99674
To generate ten questionnaire versions, CVA repeated the search process 100 separate times (passes). The D-Efficiencies for the best 10 passes are displayed (and these best 10 passes are used as the 10 versions of the questionnaire). The 9th, 40th, 74th, 98th and 67th passes all produced D-Efficiencies of 0.99740. At first glance, it might appear to the casual observer that these five questionnaires are identical. However, CVA's design algorithm ensures that each of these questionnaires, despite identical D-Efficiencies, involves a unique series of questions. To illustrate how this can occur, consider replicating a conjoint design to create a second version, and for that second version interchanging the labels for levels 1 and 2 of the first attribute. The design efficiency is unaffected by interchanging the labels (it doesn't change the coding of the X matrix), but the questions are now different across the two versions.
D-efficiency ranges from a low of 0 to a high of 1.0. Design efficiencies near 1.0 suggest that this design is about as good as can be achieved to estimate main effects with a high degree of precision, given our particular settings and the number of questions we requested (21). With most design specifications, it is impossible to achieve D-efficiency of exactly 100%.
Should we be concerned that designs 6 through 10 have slightly lower D-Efficiency than the best 5 designs? For all practical purposes, the difference in a D-Efficiency of 0.99740 versus 0.99674 is negligible. However, you can always repeat the design procedure and ask CVA to work harder (by altering the Advanced Settings) so that the top 10 designs all have a better chance of being the optimally efficient design.
Close the CVA Design Report window by clicking Close.
Investigating the Effect of Prohibitions
(Note: the example below shows how to use prohibitions to achieve more realistic pricing for different skyboxes. Please note that one could use the advanced "conditional pricing" approach as described elsewhere in this documentation. To keep things simpler, we demonstrate the "prohibitions" approach within this introductory tutorial.)
You may recall that Dr. Coldridge had suggested that some combinations of Location and Price might be prohibited. A 50-yard line skybox at the lowest price may be entirely unreasonable.
Prohibitions will almost always lower the D-efficiency of the design as reported by CVA. However, there are other considerations when designing good conjoint studies. Conjoint tradeoffs that result in an obvious answer (e.g. an alternative on the right clearly superior on all aspects over the one on the left) are less efficient than those questions implying more difficult tradeoffs. However, too much balance in terms of expected utility among competing alternatives can make for very challenging questionnaires and increased response error. The researcher should strive for a good balance between efficiency and utility balance. Sacrificing a small degree of D-efficiency for the sake of better utility balance and avoiding nonsensical combinations is probably a wise compromise.
The two prohibitions suggested by Dr. Coldridge might be represented using the following grid of joint occurrences:
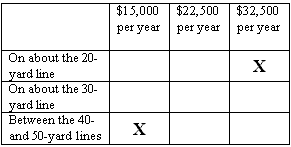
The "Xs" represent joint occurrences of Location and Price that should be prohibited. We refer to these as extreme "corner" prohibitions, meaning that the expected utility of these cells is expected to be both highest and lowest in the table. Prohibiting these corner conditions will lead to pairwise conjoint questions that imply more difficult tradeoffs, and the unlikely combinations that were concerning Dr. Coldridge will be eliminated.
Extreme corner prohibitions are less damaging to design efficiency than prohibitions on the same row or column of the joint frequency table. Let's specify the prohibitions represented in the grid above. To specify prohibitions, go to the Attributes tab of the CVA Exercise Settings dialog. Click the Prohibitions... button.
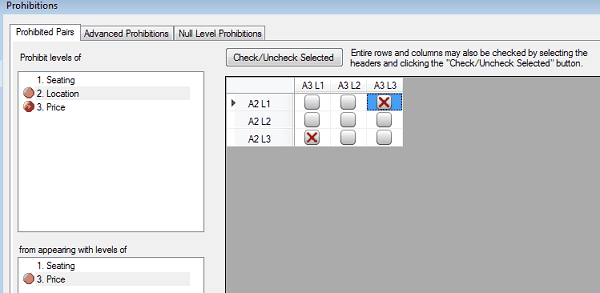
The Prohibitions dialog is displayed. Click Location in the upper panel, and then click Price in the second lower panel that appears. Then, check the two cells in the grid representing the prohibitions between Attribute 2 Level 3 and Attribute 3 Level 1; and Attribute 2 Level 1 and Attribute 3 Level 3. As you hover your mouse over each cell, tool tips appear to remind you what level text is associated with each prohibition.
Click OK, and a message appears warning you that the design you previously created is now invalid. Click Yes to delete the previous design file.
Return to the CVA Exercise Settings on the Design tab, and click Generate Design.
When you recompute the design, you will discover that the design efficiencies for the top 10 versions of the questionnaire range from 0.95451 to 0.95630. This represents about a 4% decline in efficiency relative to the design with no prohibitions (recall that the D-efficiencies for the top 10 versions previous ranged from 0.99674 to 0.99740). Together with Dr. Coldridge, you decide that the small loss in overall D-Efficiency is worth the added realism that the prohibitions bring to the conjoint tradeoffs.
To see the effect of the prohibitions on each attribute in the design, you should run a more in-depth diagnosis of the design as provided by CVA's Test Design facility. Close the CVA Design Report dialog by clicking Close. Then, click the Test Design button from the Design tab.
CVA Design Efficiency Test
Copyright Sawtooth Software
Tasks are 'Pairwise' using a seed of 1.
Based on 10 version(s).
Includes 210 total tasks (21 per version).
Each task includes 3 attributes.
Design Version Efficiencies
-------------------------------------------------------------
Version Efficiency
1 0.95630
2 0.95601
3 0.95546
4 0.95516
5 0.95516
6 0.95511
7 0.95508
8 0.95477
9 0.95477
10 0.95451
Attribute Efficiency Coefficients (including all versions)
-------------------------------------------------------------
Attribute Efficiency
Seating 0.996
Location 0.839
Price 0.849
The D-Efficiencies for the top 10 versions are repeated. Then, efficiencies for each attribute are reported (considering all 10 versions have been appended). The prohibitions we specified were between attributes 2 and 3. We see evidence in a loss in efficiency particularly concentrated on these two attributes (relative efficiencies of 0.839 and 0.849). Note that the efficiency estimation for each attribute is based on a different method than D-Efficiency, the details of which are provided in the CVA Technical Paper. We suggest you pay most attention to D-Efficiency, as it is a stronger measure of design efficiency and is more accepted in the industry. The relative efficiency coefficients by attribute are useful for pointing out problem areas in a design.
The next section of the Test Design report shows the one-way frequency of levels across all versions of the questionnaire (the Total column), and for each of the 10 questionnaire versions:
One-Way Frequencies (by version)
-------------------------------------------------------------
Level Total Ver1 Ver2 Ver3 Ver4 Ver5 Ver6 Ver7 Ver8 Ver9 Ver10
12-person seating ca 139 14 14 14 14 14 14 14 13 14 14
18-person seating ca 141 14 14 14 14 14 14 14 15 14 14
24-person seating ca 140 14 14 14 14 14 14 14 14 14 14
On about the 20-yard 122 12 12 12 12 12 13 12 12 12 13
On about the 30-yard 176 18 17 17 18 18 17 18 18 18 17
Between the 40- and 122 12 13 13 12 12 12 12 12 12 12
$15,000 per year 124 12 12 12 13 13 13 13 12 12 12
$22,500 per year 173 18 17 17 17 17 17 17 18 17 18
$32,500 per year 123 12 13 13 12 12 12 12 12 13 12
Note that the ten versions of the design are nearly perfectly balanced with respect to the first attribute (only version 8 shows a slight imbalance). This could be remedied by repeating the design procedure and using the Advanced Settings to ask CVA to work longer on the problem. Attributes 2 and 3 are not nearly as balanced, due to the prohibitions we imposed.
Finally, the two-way frequencies for the aggregate design (across all ten versions) are displayed:
Two-Way Frequencies (all versions)
-------------------------------------------------------------
Att/Lev 1/1 1/2 1/3 2/1 2/2 2/3 3/1 3/2 3/3
1/1 139 0 0 42 58 39 43 56 40
1/2 0 141 0 40 60 41 41 60 40
1/3 0 0 140 40 58 42 40 57 43
2/1 42 40 40 122 0 0 61 61 0
2/2 58 60 58 0 176 0 63 52 61
2/3 39 41 42 0 0 122 0 60 62
3/1 43 41 40 61 63 0 124 0 0
3/2 56 60 57 61 52 60 0 173 0
3/3 40 40 43 0 61 62 0 0 123
Note that Attribute 2 level 1 was prohibited from ever showing with Attribute 3 Level 3; and Attribute 2 Level 3 was prohibited from being shown with Attribute 3 Level 1. We haven't taken the space to show the two-way frequency tables for each version of the questionnaire, but they are also available for your reference.
Click Close to exit the CVA Test Design Report, then click OK to exit the CVA Exercise Settings dialog.
Questionnaire Layout
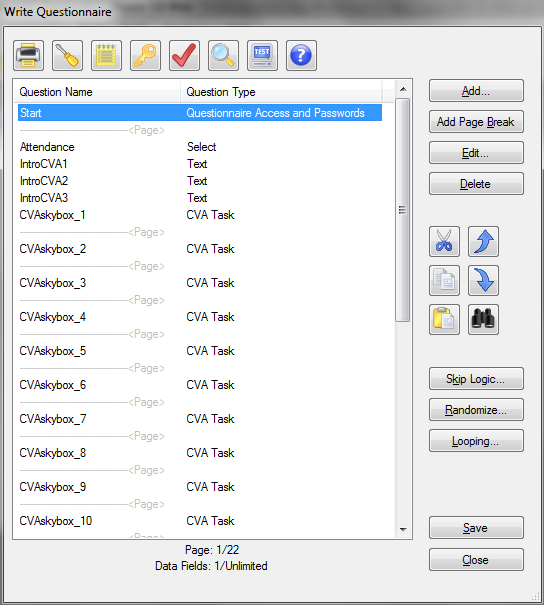
Let's now examine the questionnaire we've built to this point. Click Compose | Write Questionnaire or click the "pencil" icon ![]() on the toolbar, and the following dialog is displayed:
on the toolbar, and the following dialog is displayed:
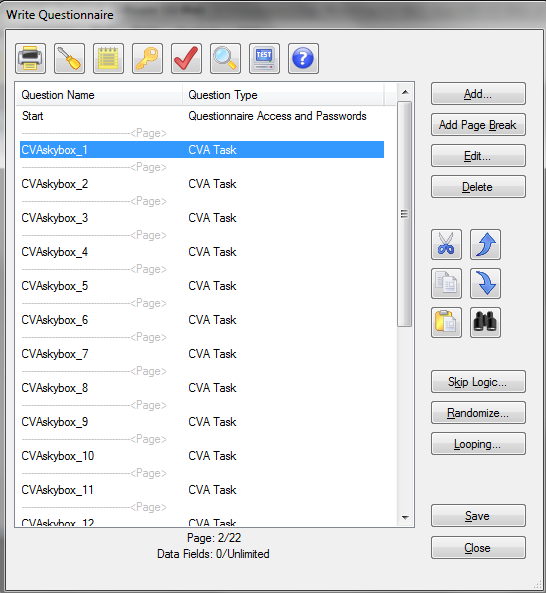
You'll note that Lighthouse Studio has added 21 conjoint tasks (CVAskybox_1 through CVAskybox_21) to the survey. These questions are based on your settings and the default template.
We can edit any CVA task to preview how Lighthouse Studio displays the conjoint questions to respondents. Highlight the CVAskybox_1 question on the list, and click Edit... (or, you can double-click the CVAskybox_1 question to edit it).
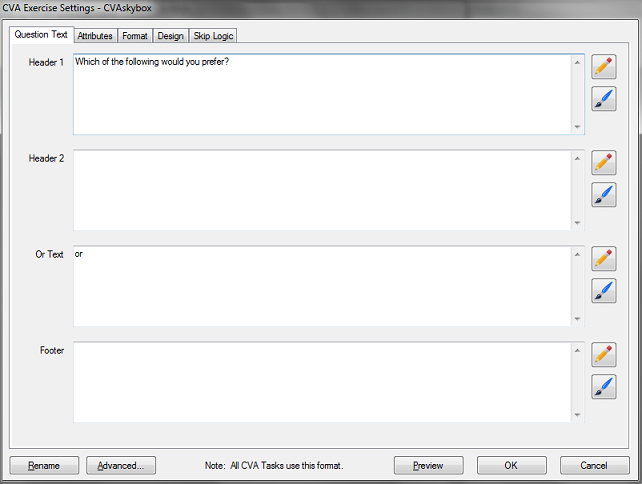
The CVA question type has main four areas where you control supporting text: Header 1, Header 2, Or Text, and the Footer. To see what your question looks like (using the default layout options), click Preview.
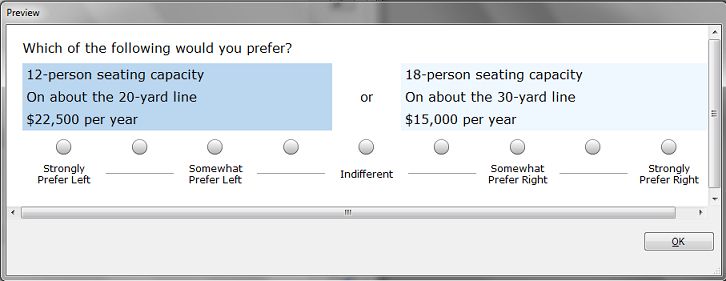
Note that by default, we use "alternating colors" for the background color of the product concept areas. The colors alternate between left and right in subsequent questions to give respondents a visual clue that the aspects of the questions (the product characteristics) are changing. The colors that are currently being used are those supplied automatically by the Style that has been selected by the survey. Later, we'll show you how to select a different style.
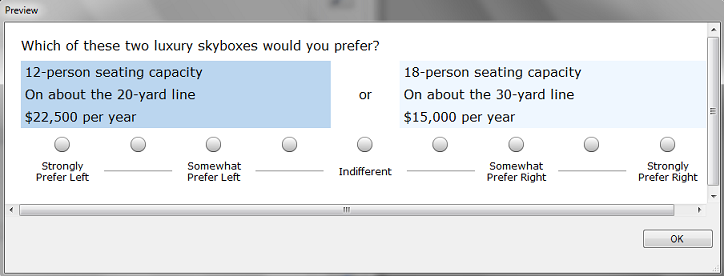
The questionnaire we developed with Dr. Coldridge included the following text in the header: "Which of these two luxury skyboxes would you prefer?". We need to change the default text provided by CVA to include the text we intend to use.
Go ahead and close the browser window and return to edit the CVA question. Note that the default text to change also includes some "commented-out" text intended for use with the single-concept at a time format. (Note: the <!-- --> tag in HTML tells the browser to ignore any text found within the tag.)
Change the Header 1 text to say: Which of these two luxury skyboxes would you prefer?
Click Preview, and the following is displayed:
You only need to edit one of the CVA questions to create the formatting as you desire. The changes you make in one CVA question apply to all CVA questions in your survey.
Passwords and the Start Screen
Placing a survey on the web makes it convenient for a geographically dispersed population to take surveys. However, the danger is that the survey may become available to people that have not been invited to take the survey. Also, some respondents might try to take the survey multiple times. Assigning respondent passwords is a way to deal with both of these issues. Password assignment is beyond the scope of this tutorial, so to make things simple we'll assume that no passwords are to be used.
The Start screen is placed as the first page in your questionnaire, whether you are using passwords or not. If you are using passwords, it is the page in which respondents type passwords to access the survey. If not using passwords, you'll use this screen to specify any introductory/welcome text.
Let's enter the introductory text into the Start screen using the Write Questionnaire dialog. You can access the Write Questionnaire dialog by selecting Compose | Write Questionnaire… or by clicking the "pencil" icon ![]() on the toolbar.
on the toolbar.
The introductory text and other survey questions would most likely be initially developed within a word processing document. Assuming you really had such a document, you might use the Ctrl-C to copy, and the Ctrl-V shortcuts to paste the information into Lighthouse Studio. We suggest you simply copy-and-paste the text within this document into your questions rather than re-type the text (if viewing this document with Acrobat Reader, you can use the "text select" icon ![]() from the Acrobat Reader toolbar.)
from the Acrobat Reader toolbar.)
The introductory screen is as follows:
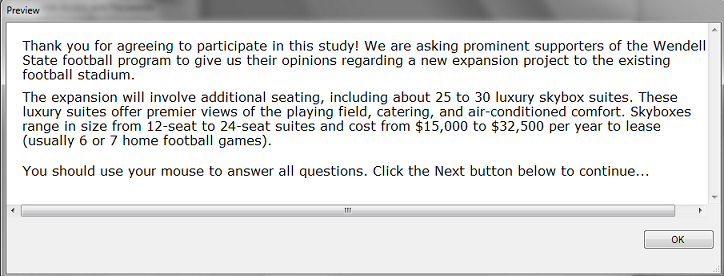
Start:
Thank you for agreeing to participate in this study! We are asking prominent supporters of the Wendell State football program to give us their opinions regarding a new expansion project to the existing football stadium.
The expansion will involve additional seating, including about 25 to 30 luxury skybox suites. These luxury suites offer premier views of the playing field, catering, and air-conditioned comfort. Skyboxes range in size from 12-seat to 24-seat suites and cost from $15,000 to $32,500 per year to lease (usually 6 or 7 home football games).
You should use your mouse to answer all questions. Click the Next button below to continue...
|
We'll insert this introductory screen in the Start question that is automatically the first question of any Lighthouse survey. From the Write Questionnaire dialog open the Start question by highlighting it in the list of questions and clicking Edit.... Alternatively, you can double-click the Start question, and it automatically opens. The Questionnaire Access and Passwords dialog is displayed::
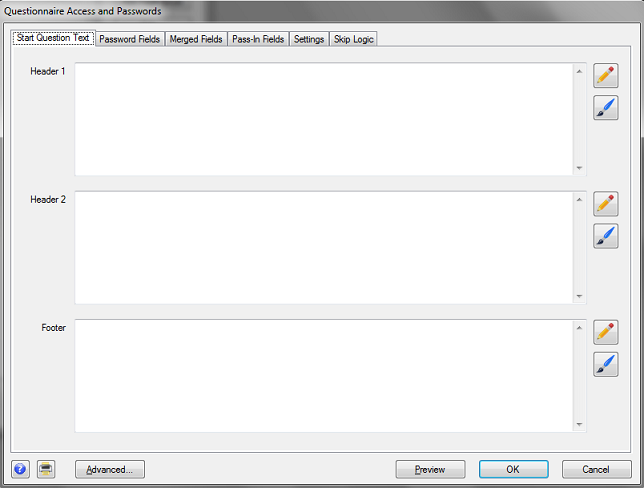
Most question types have "Header 1", "Header 2," "Body" and "Footer" sections. (The Start question has all but the "Body" section.) These are "text" areas in which you can insert any text (including HTML). When the question is viewed with a web browser, the sections are organized roughly as follows:
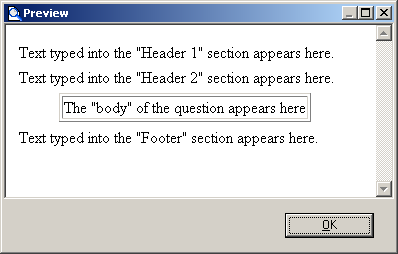
For this introductory screen (that includes three paragraphs of information), it seems to make sense to place the first paragraph in the "Header 1" area, the second paragraph in the "Header 2" area, and the third paragraph in the "Footer" area.
Type (or cut and paste) the following text for the Start question into the text areas in the Start question. Put the first paragraph in Header 1, the second paragraph in Header 2, and the third paragraph in Footer.
Thank you for agreeing to participate in this study! We are asking prominent supporters of the Wendell State football program to give us their opinions regarding a new expansion project to the existing football stadium.
The expansion will involve additional seating, including about 25 to 30 luxury skybox suites. These luxury suites offer premier views of the playing field, catering, and air-conditioned comfort. Skyboxes range in size from 12-seat to 24-seat suites and cost from $15,000 to $32,500 per year to lease (usually 6 or 7 home football games).
You should use your mouse to answer all questions. Click the Next button below to continue...
The main dialog only shows a portion of the text, but you can click the "pencil" icon ![]() adjacent to each text area to expand the text editing window.
adjacent to each text area to expand the text editing window.
To preview how the question will look when it runs on the respondent's computer using Windows Explorer, click the Preview button. The question is displayed in "Preview" mode (no data are saved, and no special "error checking" or "validation" is performed for the question).
Lighthouse Studio automatically places paragraph breaks (extra blank lines) between the Header 1, Header 2, and Footer sections. If you put all the text in a single section, you may see that when the web browser interprets the text, it all runs together without any blank lines between the paragraphs (unless you insert some HTML instructions to force blank lines between paragraphs). We'll talk about using HTML within your text to take greater control over the layout, font, and style later in this unit.
Click the OK button of the Preview window to close that window and return to the previous dialog.
After you are happy with the layout of the Start screen, click OK to return to the Write Questionnaire dialog. If you need to move a question once it has been added to the List of Questions, simply highlight the question to be moved and click the ![]() or
or ![]() buttons to move the questions within the list (you can also highlight a question and click Ctrl-X or Ctrl-C to cut or copy and Ctrl-V to paste questions within the current questionnaire, or even to another study.)
buttons to move the questions within the list (you can also highlight a question and click Ctrl-X or Ctrl-C to cut or copy and Ctrl-V to paste questions within the current questionnaire, or even to another study.)
Select-Type Questions
Now you are ready to specify the first Select-Type question:
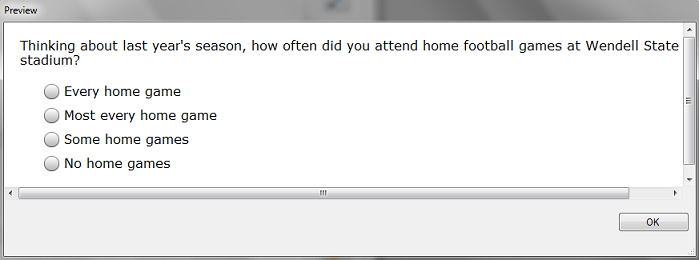
Attendance:
Thinking about last year's season, how often did you attend home football games at Wendell State stadium?
m Every home game m Most every home game m Some home games m No home games
|
First, make sure that you highlight the page break directly beneath the Start question on the List of Questions (when you add a new question, it is placed directly below the highlighted question/page break on the list). At the Write Questionnaire dialog, click Add..., choose Select as the question type, and type Attendance for the question name. Click OK and the Select Question dialog is shown.
Place the heading text for the question in the Header 1 field. To specify the response options, click the Response Options tab. From the Response Options tab, use the Add button to add the four response options for this question. When you are finished, the question should look something like:
Now that you have seen how to specify Single Select question types, you have the tools you need to specify the other two select-type questions for this questionnaire (Interest and Holdout--Please refer to the questionnaire text for these questions as presented near the front of this unit).
The Holdout question layout poses some interesting challenges. The simplest approach is to format it as a Select-type question with three columns (specify #columns on the Settings tab of the Select Question dialog). The Holdout question formatted as a Select-type question looks like:
To do this, we formatted each option as a separate Response Option, with additional HTML text to force hard returns and a blank line. For example, the first response option is formatted as:
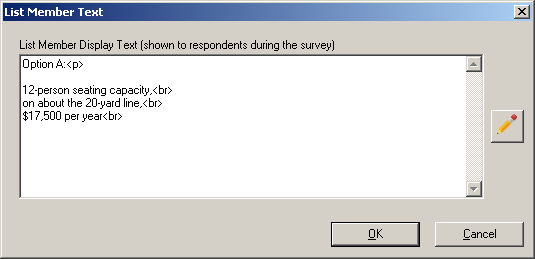
However, you can make this holdout choice task look even nicer if you format it as a Grid-type question (one row, three columns, radio buttons). On the Rows tab, make sure to un-check the Show Row Labels box. From the Columns tab, add three Predefined List Members (List Member Text just as shown directly above) to show each of the three product concepts. When you click Preview, the grid question should look something like:
Formatting Text in Lighthouse Studio Questions
In addition to the Select questions we added to the questionnaire previously, there are four text-only instructional screens to add. Referring to the questionnaire we outlined earlier, these "questions" are named IntroCVA1, IntroCVA2, IntroCVA3, and Finish. Even though the respondents aren't asked to provide specific inputs to these, we refer to these as "questions" in the sense that we add them to the questionnaire as if they were standard questions, and they are listed separately by their "question" name in the List of Questions.
After the Attendance question follows the text-only instructions:
IntroCVA1:
During this survey, we're going to ask you to consider features of luxury skyboxes.
These luxury boxes offer plenty of space for you and your guests to relax and enjoy the game. These are fully enclosed suites, with floor-to-ceiling glass fronts for complete visibility of the playing field.
Features include: •Air conditioning/heating •Fully carpeted, padded swivel chairs •Video monitors •Buffet table in the back
Valet parking and catering are also available.
|
This text layout is a bit more challenging than we dealt with before (when we put three paragraphs of introductory text into the Start question). There are more than three separate paragraphs here, there is a bullet point list, and we'll need to deal with the additional element of bolding selected text.
Add a Text question directly following the Attendance question in the questionnaire. To do so, highlight the Attendance question, click Add…, and specify the Question Name as IntroCVA1 and the question type as Text.
The Text dialog is displayed.
Earlier in this tutorial, when we used the Start question to format the opening page of the survey, we placed each paragraph of text in a separate Header 1, Header 2, or Footer section. We saw that Lighthouse Studio automatically places blank lines between text in these sections. However, with the text in the IntroCVA1 question, there are more paragraph breaks to insert. We'll take the opportunity here to introduce the concept of using a few simple HTML instructions within our survey text.
HTML stands for "HyperText Markup Language" and provides simple ways for you to enhance the look of your surveys, such as by bolding or underlining words, or making paragraph breaks within text. Browsers know how to interpret HTML instructions when displaying the page on the screen. If you know HTML, you can use it whenever you wish within your surveys to accomplish your aims. If you don't know HTML, it isn't very difficult to learn a few HTML tricks, or you can use the toolbar available within the editor that appears when you click the "Pencil" icons ![]() :
:
Either type or cut-and-paste the text for the IntroCVA1 question into the Header 1 text field (Any of the other three fields could be used also, though the Body field is indented). Click the "Pencil" icon ![]() to display the larger text editing window. Initially, the text appears something like this:
to display the larger text editing window. Initially, the text appears something like this:
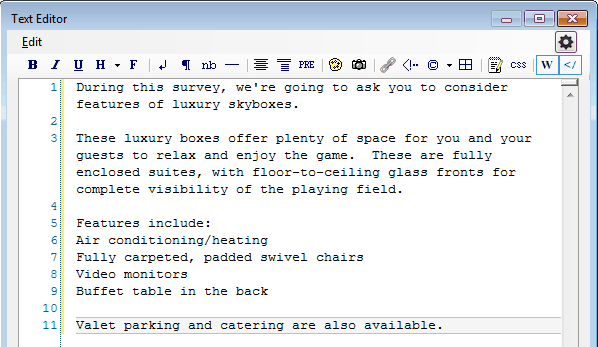
Even though it appears that there are extra blank lines between the paragraphs, web browsers ignore these hard returns (as well as more than one consecutive space characters), so you'll need to provide HTML instructions to insert these paragraph breaks (hard return plus blank line). HTML instructions are placed within <> brackets, called "tags." For example, the HTML instruction to create a paragraph break begins with an "open" paragraph tag written as <p> and optionally ends with a "close" paragraph tag written as </p>. The text to be formatted as a separate paragraph is enclosed within these tags. You can either directly type HTML within your document, or you can highlight text to be modified and click the icons on the HTML toolbar in the editor. If you highlight the first paragraph with your mouse:
During this survey, we're going to ask you to consider features of luxury skyboxes.
and then (with the text in the first paragraph highlighted) click the "Paragraph" icon ![]() on the toolbar, this inserts a <p> prior to the text and a </p> after the text:
on the toolbar, this inserts a <p> prior to the text and a </p> after the text:
<p> During this survey, we're going to ask you to consider features of luxury skyboxes. </p>
When the browser interprets this text, it doesn't display the "tags" but instead separates the text enclosed within the tags as a separate paragraph. Repeat the same for each of the paragraphs in the IntroCVA1 question.
Next, we need to add a bullet point list. The following HTML tags are used to create bullet point lists:
<ul> </ul> (open and close tags for an unordered bullet list)
<li> </li> (open and close tags for list elements within an unordered bullet list)
When you apply these HTML elements within the text for this question, you'll specify:
<p>Features include:
<ul>
<li>Air conditioning/heating</li>
<li>Fully carpeted, padded swivel chairs</li>
<li>Video monitors</li>
<li>Buffet table in the back</li>
</ul>
</p>
Next, we need to bold certain words in the text. The HTML tags for bolding text are <b></b> (with the text to be bolded placed between the open and close bold tags). You can either directly type these tags within the document, or highlight the text to be bolded with the mouse and click the "Bold" icon ![]() on the toolbar. After you finish separating the paragraphs with <p></p> tags, applying the bullet list instructions, and bolding the appropriate text with <b></b> tags, it should look something like:
on the toolbar. After you finish separating the paragraphs with <p></p> tags, applying the bullet list instructions, and bolding the appropriate text with <b></b> tags, it should look something like:
Click OK to return to the Text dialog and then Preview to see how the web browser displays this question. It should look like:
When you add the Finish question at the end of the survey, make sure to add it at the end of the survey as a Terminate question type. On the Settings tab of the Terminate question, click Terminate Respondent to indicate that respondents that reach this question are finished. Lighthouse Studio may warn you at this point that a terminating question must stand alone on its own "page" in the survey. This leads us into our next discussion on page layout.
Page Layout and Study Settings
It may be helpful at this point to review how Lighthouse Studio breaks the survey into separate pages, and some basic global settings that affect the look and functionality of your questionnaire. The Write Questionnaire dialog also displays the page breaks that may be currently set for your questionnaire.
This dialog shows how the various questions we've specified (or that Lighthouse Studio has automatically added to the list) are arranged across different pages. Page breaks are indicated by "---------------<Page>". Notice that the preliminary questions (Attendance, IntroCVA1, IntroCVA2, and IntroCVA3) we've added to the questionnaire are all currently arranged on the same page. Let's assume we wanted to break these up, one question per page. You add a page break after the Attendance question by highlighting Attendance on the list and clicking the Add Page Break button. Attendance is now placed on its own page. Repeat this operation to place IntroCVA1, IntroCVA2, and IntroCVA3 on separate pages. You may also choose to place Interest and Holdout questions on their own pages. Make sure to place the final Terminate screen Finish on its own (last) page.
Adding Polish and Style
You have probably noted that the survey we've created is pretty bland looking. We can add some polish and style by clicking the Survey Settings icon ![]() from the Write Questionnaire dialog (or by clicking Compose | Survey Settings from the main menu).
from the Write Questionnaire dialog (or by clicking Compose | Survey Settings from the main menu).
First, let's select a style from the Styles tab. Select a style you wish to use, and click Use Selected at the bottom of the dialog to implement the style. We'll select Panama as the style, but you might want to experiment with other styles.
On the General Settings tab, you can select to use graphical Submit, Previous, and Select/Checkbox buttons. A library of buttons is provided, available in the C:\Program Files\Sawtooth Software\Lighthouse\graphics folder.
On the Headers and Footers tab, you can specify a Header and a Footer. We'll specify Skybox Questionnaire as the header text.
The Progress Bar tab lets you add a progress bar to your survey. We'll click the check box to add a progress bar to the page footer.
When you go back and test run the survey, your survey should have a bit more polish. Under Panama style, our survey now looks like:
Test Running Your Survey Using "Local Test Server"
Although the Preview Survey function is nice, you generally will want to test your survey in runtime mode, with any skip patterns, response verification, and randomizations in place. You could upload your files and the Perl scripts to the Web Server, but Lighthouse Studio provides a more convenient way to test run your survey locally on your PC or laptop.
When Lighthouse Studio was installed on your computer, web server software called "Apache" was also installed. Apache lets your computer run the questionnaire just like a remote Web Server would.
Local Test Server
From the Write Questionnaire dialog, Click the Test Survey button ![]() .
.
Your browser opens up the first survey page. This is your survey, as it would appear to a respondent over the Internet (there are slight visual differences from browser to browser).
To close the survey, simply close the browser window (using the X in the upper-right hand corner). To run the survey again, click the Test Survey button ![]() .
.
After you have edited the survey to the point that you are pleased with the look, content, and functionality of your survey, we suggest you take the survey yourself under Local Test Server. You should answer each question legitimately and carefully.
After you have taken the questionnaire carefully as suggested above, you should download the data (downloading data is described in a separate tutorial called "Getting Started with Lighthouse Studio: A 45-minute Hands-On Tour"), then compute and examine your part-worth utilities. The part-worths should very closely reflect your preferences. If they don't, this suggests something may be wrong with your study setup.
After you are convinced that the survey is functioning properly, you should also pretest your survey among your colleagues. They can give you feedback regarding the usability of the survey, and you can examine the resulting part-worths to make sure the data at least have face validity.
Pretesting and Fielding
Let's now return to the marketing problem and story we began at the beginning of this document.
After you have tested the survey using the Local Test Server, you post the survey to the Web using Sawtooth Software's hosting service). You send an email to Dr. Coldridge, with a link to your survey, and she browses to and takes the survey. After she give you some feedback, you invite six other individuals in administration and planning take the survey. You download the data and compute part-worth utilities. Due to the small sample size, the results are a bit noisy, but the data seem to feel right.
Next, you recruit six respondents from the actual sampling frame to come to a central site to take the survey. You watch silently as they take the survey. At the end of each session, you ask each respondent follow-up questions to ensure that there weren't any parts that were difficult to understand or just didn't make sense. You ask them specifically about the conjoint questions, making sure that they understood what to do, and that they didn't feel overwhelmed by the task. After debriefing the test respondents and analyzing their data to ensure that the results look reasonable, you make a few small adjustments and proceed to field.
Data Management
Lighthouse Studio includes an Admin Module so that you can monitor or access your project from any computer connected to the Web. The Admin Module is password protected, and your passwords for access are specified on the Field | Hosting Management dialog. Lighthouse Studio generates random administrative access passwords whenever you create a new study, but you can modify them to suit your needs.
To download the data from the respondents to the Skybox study, you can browse to the administrative module for your study on the web site (again, we are speaking hypothetically, as for this tutorial study there is no such site set up). Once at the Admin Module, you would download your data (by clicking Download from the main menu), making sure to save your data file to the same folder on your hard drive in which you developed the project. Alternatively, from the Lighthouse interface, you can simply click Field | Get Data to download your data without logging into the Admin Module.
You can also use the Admin Module to tabulate results from your Select-type questions. For example, you might be interested in the responses to the Holdout question. Once within the Admin Module, you can request a tabulation of each question in the survey (the Marginals function). The tabulation for the Holdout question for 50 hypothetical respondent records for this tutorial study is as follows:
Holdout
Option A: 12-person seating capacity... 9
18.0%
Option B: 18-person seating capacity... 20
40.0%
Option C: 24-person seating capacity... 21
42.0%
Total 50
100.0%
The report shows that 18% of respondents chose Option A, 40% chose Option B, and 42% chose Option C.
To download the data from the 50 respondents to the Skybox study, you would browse to the administrative module for your study on the web site (again, we are speaking hypothetically, as for this tutorial study there is no such site set up). Once at the Admin Module, you would accumulate and download your data (by clicking Download from the main menu), making sure to save your data file to the same folder on your hard drive in which you developed the project.
Once you have downloaded the data, you are ready to estimate part-worths. If you try this with this tutorial study you created, you will receive an error stating that you have no data within your project folder to analyze. However, hypothetical data for this project are available as a sample CVA study in your Lighthouse Studio installation. If you wish to follow along with the analysis steps below, open the CVA Tutorial project we have provided by clicking Help | Sample Studies | CVA Sample.
To compute utilities, click Analysis | Analysis Manager…. Click Add and select OLS as the Analysis Type. Click the Settings icon ![]() to see the settings that govern this utility run. When you click the Scale dialog, the range of respondent answers is shown (as specified in your questionnaire). The recode method is the dependent variable transformation. For most applications, we suggest a logit rescaling. It is beyond the scope of this tutorial to discuss dependent variable transformations, but more information on that subject is available in a section entitled: "CVA Ordinary Least Squares Settings". The range of the respondent answers (1 to 9) and the scale direction are indicated. This pairwise questionnaire uses a sliding scale with the lowest number on the left and the highest number on the right, so the correct scale direction to choose is Highest Number on Right.
to see the settings that govern this utility run. When you click the Scale dialog, the range of respondent answers is shown (as specified in your questionnaire). The recode method is the dependent variable transformation. For most applications, we suggest a logit rescaling. It is beyond the scope of this tutorial to discuss dependent variable transformations, but more information on that subject is available in a section entitled: "CVA Ordinary Least Squares Settings". The range of the respondent answers (1 to 9) and the scale direction are indicated. This pairwise questionnaire uses a sliding scale with the lowest number on the left and the highest number on the right, so the correct scale direction to choose is Highest Number on Right.
While still at the CVA Ordinary Least Squares Settings dialog, click Constraints to edit the utility constraints. Utility constraints impose any rank order of preference assumptions you have made for the levels within attributes. Any a priori order settings you used when specifying the attributes are available to you as utility constraints if you click Use Constraints. Click Use Constraints. Currently, you have set the Location attribute as Worst to best ranking, meaning the first level ("On about the 20-yard line") is worst and the last level ("Between the 40- and 50-yard lines") is best. The Price attribute is set as Best to worst. These constraints will be enforced during utility estimation if you have clicked the Use Constraints box. If you wish to modify these selections prior to calculating utilities, you can do so from this screen. There is an additional area for specifying constraints that involves just pairs of attribute levels. If some attributes are partially ordered, you may specify those constraints using the Custom Constraints button. Click the OK button to return to the Analysis Run Manager.
Once you are satisfied with your utility estimation settings, click Run. Lighthouse Studio first scans your data file and gives a summary report of the conjoint information:
** Data Summary **
Number of respondents included = 50
Total tasks included across all respondents = 1050
Number of constraints = 2
The data will be written to the following file: c:\temp\cva2\cva2 OLS.utl
When you click Estimate Utilities, Lighthouse examines each respondent's data and computes a set of utilities for each level in your study for each respondent. For more information about interpreting utility values in conjoint analysis, please see Appendix B in this documentation, entitled: "Interpreting Conjoint Analysis Data".
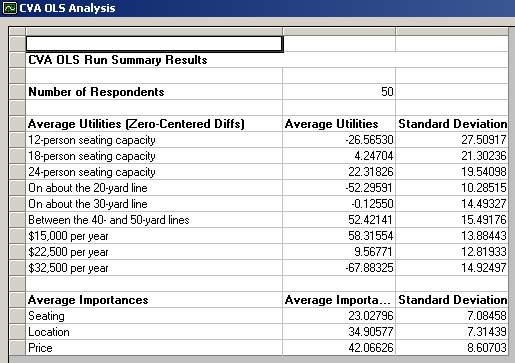
A report window is displayed in a spreadsheet format with two sheets (tabs located at the bottom of the display): Summary and Individual Utilities. On the Summary sheet, the average part-worth utilities (scaled according to the normalization procedure called Zero-Centered Diffs) and attribute importances for the sample are displayed, along with standard deviations.
The Summary tab results report also contains diagnostic information about the utility run:
Tasks Included: All Pairwise
Recode Method: Logit
Additional Utility Constraints:
All Attribute Levels:
Attribute 2, Attribute 3
Successfully computed utilities for 50 respondents.
Average R-squared = 0.78974
Median R-squared = 0.81081
Number of constraint violations resolved:
Attribute 2 Level 2 preferred to Level 1: 1 Respondents
Attribute 2 Level 3 preferred to Level 2: 1 Respondents
Attribute 3 Level 1 preferred to Level 2: 1 Respondents
Attribute 3 Level 2 preferred to Level 3: 2 Respondents
You are shown the average and median R-squared (fit) values for the data set. R-squared is bounded by 0 and 1.0, with 1.0 indicating perfect fit (note that the reported R-squared is the fit after imposing any constraints on the data). Below that, you see a report of any reversed utility relationships that had to be resolved. Respondents answer with some degree of error, and most data sets in practice will have many reversals at the individual level, especially for attributes with relatively low importance. This tutorial data set was artificially developed and has very few out-of-order relationships.
If you discover that a large proportion of respondents in your data sets have certain out-of-order relationships, this suggests one or more of the following explanations:
1. The violated preference relationships are of low importance to respondents (minimal actual difference in "true" part-worths),
2. Your assumptions regarding the utility relationships are faulty (you may need to change your assumptions under the Constraints dialog, accessed by clicking Analysis | Analysis Manager... | Settings ![]() | Constraints),
| Constraints),
3. The respondents answered with a high degree of error,
4. Your design was inefficient or did not include enough questions to stabilize the utility estimates,
5. You have made a data processing error.
If more than half of the respondents violate a particular rational preference relationship, it is definite cause for concern.
If you open the Individual Utilities sheet (by clicking the Individual Utilities tab near the bottom of the report), you can view the raw individual-level utilities for each respondent:
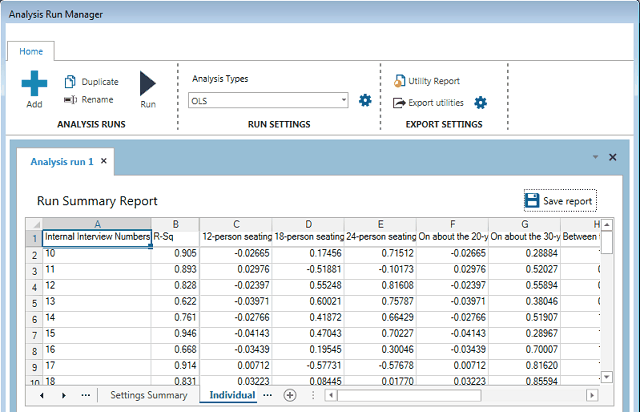
The Respondent number and R-Squared are displayed in the first two columns. The part-worth utilities for each level within the study start in column 3.
Let's examine the average utilities report back on the Summary tab again.
Scenario:
Utility Run: CVA OLS Run
Average Utility Values
Rescaling Method: Zero-Centered Diffs
12-person seating capacity -26.57
18-person seating capacity 4.25
24-person seating capacity 22.32
On about the 20-yard line -52.30
On about the 30-yard line -0.13
Between the 40- and 50-yard lines 52.42
$15,000 per year 58.32
$22,500 per year 9.57
$32,500 per year -67.88
Total Respondents 50
Average Importances
Seating 23.03
Location 34.91
Price 42.07
Total Respondents 50
<<The above average utilities are rescaled utilities using the zero-centered "diffs" method. The diffs method rescales utilities so that for each individual the total sum of the utility differences between the worst and best levels of each attribute across attributes is equal to the number of attributes times 100. >>
For more about interpreting conjoint utilities, please see Interpreting Conjoint Analysis Data.
It is difficult to make firm conclusions from just these fifty respondents, but we might try to form some tentative conclusions:
First, looking just at the report of average importances (the second section above), it appears that the least important attribute (among the three attributes and the feature ranges we measured) is whether the skybox has 12-person or 24-person seating capacity. Looking at average utility values, we see that if everything else was held constant (price and location on the field), respondents on average would prefer to have more seating capacity than less in the skybox.
Many important effects due to the competitive context, respondent heterogeneity and correlations of preferences among attribute levels can occur within a data set. These may be completely obscured by viewing just average utilities and importances. Also, the concept of utility scores seems difficult to grasp for many managers. For these reasons, running market simulations offers a more powerful and revealing way to look at conjoint data.
Market Simulations
To open the Market Simulator, click Analysis | Choice Simulator or double-click Market Simulator icon from the toolbar. The first time you open the Market Simulator for a study, there are no Simulation Scenarios yet specified. A Simulation Scenario is a particular "what-if" scenario, wherein certain products are placed in competition with one another in a simulated marketplace.
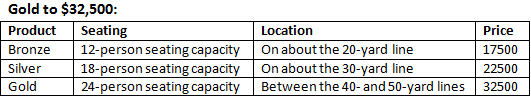
Prior to fielding your study, Dr. Coldridge had conferred with the administration's planning group regarding potential configurations for skyboxes. The result was three principal alternatives, which were used as a holdout question in your CVA survey:
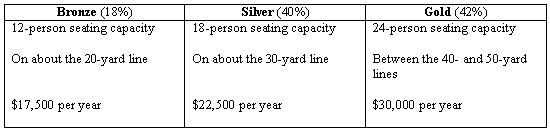
You may recall that the tabulation of the Holdout question showed that 18% of respondents preferred the Bronze option, 40% preferred the Silver option, and 42% preferred the Gold option.
Notice that two of the levels of Price ($17,500 and $30,000) are in between the levels we measured in the study. The market simulator lets us interpolate between levels, so this is not a problem. However, it will be easier to specify these levels if we have assigned "Level Values" to each level.
To assign Level Values within the market simulator dialog click the Attribute Info icon within the Project Information group. Specify that the Price attribute is continuous by clicking the Is Continuous checkbox and that it also is a pricing attribute by clicking the Is Price checkbox associated with Price. Then, type level values into the grid to associate 15000 with "$15,000 per year", 22500 with "$22,500 per year" and 32500 for "$32,500 per year". Click OK to return to the Market Simulation menu.
Create a new simulation scenario by clicking Add....
When you click the Add... button, a new tab appears in the dialog for to specify your first simulation scenario, named by default My Scenario (you can change this label by double-clicking it to edit). Let's change the name of the scenario to Base Case.
Next, you'll specify the three products for your Base Case scenario. Type labels into the Label column and double-click in the other columns to pick levels that define each of the three product offerings. As you click the various columns associated with the attribute levels, the level codes will appear in the window below to remind you of the codes associated with each attribute's levels.
The attribute level codes for the three products for the planned skybox configurations were:
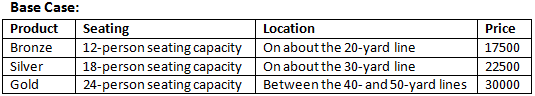
Specify these three products in the product entry grid.
After you have specified these three products, you should choose a simulation method. The default method is Randomized First Choice. We generally recommend this method for competitive market scenarios like this one, so we'll use the default.
Click the Simulate button. The choice simulator examines each respondent's record and predicts which product(s) each respondent would likely choose based on the product specifications and each respondent's utilities.
The following report is displayed:
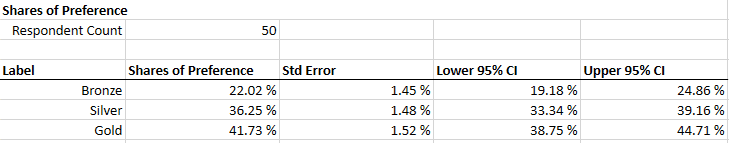
Though a total is not shown, the shares of preference sum to 100%. Standard errors are presented next to each product's shares, which are used to calculate the lower and upper 95% confidence intervals (CI).
Tuning the Market Simulator to Predict Choice
Recall that when respondents were asked to choose among these three alternative skyboxes in the Holdout question within the questionnaire, 18% preferred the Bronze option, 40% preferred the Silver option, and 42% preferred the Gold option. The market simulator's predicted shares as displayed at the end of the previous section show a very similar pattern of preference: the rank order is the same, but the magnitude of the share differences is a bit compressed for the predictions relative to the actual choices.
When using a ratings scale with CVA questions (recall we used a 1 to 9 scale) and OLS estimation, there is no guarantee that the resulting utilities will be appropriately scaled so that the market simulations are closely linked to choice probabilities. However, the market simulator provides a way for us to tune the scaling of the shares to better match our target holdout choice probabilities. We tune the scaling of the shares using the "Exponent".
Tuning the market simulator to best fit holdouts requires some trial and error. The first step is to compare the predicted results to the actual choice probabilities and determine a measure of fit. Let's again compare our predicted shares of preference with actual choice probabilities as determined through the Holdout question. The table below reflects the predicted shares when using the default settings for Randomized First Choice (Exponent = 1):
(Exponent=1)
Predicted Actual Absolute Difference
Shares Shares (Predicted vs. Actual)
Bronze 22.02 18.00 4.02
Silver 36.25 40.00 3.75
Gold 41.73 42.00 0.27
------
Mean Absolute Error (MAE): 2.68
On average, our predictions are 2.68 share points different from the actual target holdout shares. There are many ways to determine fit; the use of MAE (Mean Absolute Error) is one common measure.
Next, let's tune the exponent to achieve a better fit. From the Choice Simulator interface, select the Base Case Settings tab at the top of the dialog. Then, click the Exponent icon within the Miscellaneous ribbon group. Change the Exponent setting to 1.5. Choosing a higher exponent will accentuate the differences among the choice probabilities, which will move us in the right direction to achieve closer fit to the holdout probabilities. Go back to the Home tab and click Simulate. The new data are:
(Exponent=1.5)
Predicted Actual Absolute Difference
Shares Shares (Predicted vs. Actual)
Bronze 18.18 18.00 0.18
Silver 37.24 40.00 2.76
Gold 44.58 42.00 2.58
------
Mean Absolute Error (MAE): 1.84
By adjusting the Exponent from 1.0 to 1.5, we have made the resulting share predictions "steeper" and achieved a better overall fit to the holdouts. Our MAE has decreased from 2.68 to 1.84. By trial and error, you will find that the MAE is minimized when the Exponent is about 1.53 (MAE = 1.80). The data for this run are given below:
(Exponent=1.53)
Predicted Actual Absolute Difference
Shares Shares (Predicted vs. Actual)
Bronze 18.00 18.00 0.00
Silver 37.30 40.00 2.70
Gold 44.70 42.00 2.70
------
Mean Absolute Error (MAE): 1.80
For the remainder of this tutorial, set the Exponent to 1.53 so that your results match ours. If you were analyzing this data set in practice, you should use the Exponent of 1.53 for all subsequent market simulations.
Note that in practice researchers usually include more than just one holdout choice task. The exponent is adjusted to reduce the MAE across all holdout tasks. One does not choose a separate Exponent to provide best fit to each separate holdout task.
The choice simulator is a powerful tool for testing nearly an unlimited number of possible market scenarios. It is important to remember that the shares of preference resulting from conjoint predictions are not equivalent to actual market shares and often look quite different. Many other factors in the real world influence market shares and cannot be measured and reflected solely by conjoint data. Conjoint assumes perfect information, equal distribution and availability, and that each respondent is in the market and able to purchase. Conjoint results reflect the potential market acceptance, given proper promotion, distribution and time.
Sensitivity Analysis
Performing sensitivity analysis is one of the most common uses of the market simulator. Sensitivity analysis involves first simulating a base case (as we previously did), representing an array of products in competition with one another, then modifying one of the products and observing the change in share due to the modification.
For example, the planning group at Wendell State may be interested to know how raising the price for the most expensive option (Gold) would alter the relative preference among the three proposed alternatives. You may recall from the previous sections in this tutorial that the base case scenario was defined as:
The shares of preference for this base case configuration are:
Bronze 18.00%
Silver 37.30%
Gold 44.70%
The question is: how would the share of preference change if the Gold option were increased from $30,000 per year to $32,500 per year? We can create a new simulation scenario to test this possibility.
You can save a lot of time in entering this scenario if you retain the settings for the first three products when you create the new scenario. From the Home tab, click Duplicate and a new scenario is created that is a copy of your Base Case scenario.
You can name this second simulation scenario Gold to $32,500. The level codes/values for the three products for this simulation are:
After altering Gold's price, click Simulate.
We've summarized the previous shares of preference for the base case (when Gold was at $30,000) and the new shares of preference (when Gold is increased to $32,500) in the table below:
Product Shares of Preference
Base Price
Case Increase
Shares Gold
Bronze 18.00 19.70
Silver 37.30 41.73
Gold 44.70 38.57
How might the relative shares of preference change if seating capacity or position relative to the field were changed? You may wish to run additional scenarios to test those possibilities.