Overview
The CVA System is Sawtooth Software's system for traditional full-profile conjoint analysis. The traditional full-profile conjoint method was the first "flavor" of conjoint used by marketing academics in the early 1970s (Paul Green and colleagues). It continues to be useful today, more than 40 years after its first introduction.
CVA is a component within Sawtooth Software's Lighthouse Studio. CVA ("Conjoint Value Analysis") includes:
•A designer for creating the stimuli (product profiles) displayed in conjoint interviews
•A questionnaire writer for formatting the conjoint questions for computer-based interviews or paper-and-pencil surveys
•Two utility calculators for estimating each respondent's part-worth utilities (strengths of preference) for product features
•An integrated market simulator that is also used for ACA (Adaptive Conjoint Analysis), CBC (Choice-Based Conjoint), or ACBC (Adaptive CBC).
Optionally, users may purchase the CVA/HB add-on module for hierarchical Bayesian estimation of part-worth utilities. This add-on module functions seamlessly within the Lighthouse Studio interface.
CVA is one of four conjoint software packages from Sawtooth Software. The other three are CBC, Adaptive CBC (ACBC), and ACA. We have designed each package to bring unique advantages to different research situations.
About Conjoint Analysis
Conjoint analysis is a highly successful research technique for learning how potential buyers of a product or service value its various aspects or features, or more generally how people make choices. Conjoint analysis is equally useful for studying products and services (for convenience, we use the word "product" in both cases).
Examples of questions that lead market researchers to use conjoint analysis are:
•Which would be more valuable to the customer: longer warranty or more product performance?
•What would be the effect of raising our price 10%?
•What would happen if we added another product to our line that had 20% less performance but a 30% lower price?
When using conjoint analysis, a product is thought of as being made up of various attributes (sometimes called "factors"). For example, automobile attributes may be: manufacturer, color, type of engine, number of doors, and price.
Each attribute has several possible levels. For example, the levels of "number of doors" may be: two, four, and five (to include station wagons). The levels of "engine type" may be: 4 cylinder, 6 cylinder, and 8 cylinder. (The word "feature" is often used in place of "attribute level.")
Conjoint data are collected from survey respondents by asking about their preferences for hypothetical product concepts, described in terms of specific attributes and levels. In analyzing the data, one infers the value to each respondent of having each possible attribute level. These estimated values are called part-worths or utilities. With CVA, we can estimate each respondent's part-worth utility values for each level of each attribute from data collected by the conjoint questionnaire. These values are then used to make predictions about how respondents would choose among new or modified products. The goal is to conclude what product changes would have the most beneficial (or least detrimental) effect on share of preference, or which would maximize the likelihood that buyers would choose specific products.
In ratings-based conjoint analysis, product concepts can be shown to respondents one at a time, or they can be presented in pairs. Pairwise presentation can be harder for the respondent, because each question requires understanding two concepts rather than just one. However, the comparative nature of the pairwise task may let the respondent make finer distinctions and contribute more information than single concept (popularly called card sort) presentation.
The term full profile refers to product concepts that are described with respect to all the attributes being studied. For example, if the products in a particular category had six important attributes, a full profile product concept would describe the product on all six attributes.
CVA produces either single concept or pairwise full profile designs. It is questionable that respondents can consider product concepts carefully that are described using more than about six attributes in CVA. However, over the years we occasionally have heard of people wanting to use CVA's experimental design program for applications that we had not envisioned. To give users this flexibility, we allow CVA to support up to 30 attributes, each with up to 15 levels. Despite this capacity, we recommend that the number of attributes and levels for studies in practice be much smaller than these limits. With more than about six attributes, the questions may become too complex for most respondents to handle, and the number of questions that must be asked of each respondent may become excessive. If more attributes and levels are necessary, it can be advantageous to show respondents pairs of concepts described on subsets of the attributes (partial profile), as in our ACA System for Adaptive Conjoint Analysis. But, there are other more advanced approaches for tackling larger attribute lists that show promise as well, including partial-profile CBC and Adaptive CBC (ACBC).
About CVA
CVA features a variety of options and functionalities. Not all of these tools need to be used in a particular project.
The authoring and design tools can be used to produce computer-administered or paper-and-pencil questionnaires. We do not recommend the questionnaire design tool be used for studies with many attributes. With too many attributes, the questions are likely to provide too much information to the respondent, who may become overloaded and confused. For studies with more than about six to eight attributes, we often recommend using the Adaptive CBC or the ACA System for Adaptive Conjoint Analysis.
The calculation routines can be used to analyze questionnaire data and calculate respondent utilities. The two standard methods are "Ordinary Least Squares" (OLS) regression and "monotone" (nonmetric) regression. The OLS routine is appropriate for ratings-based data, and the monotone program for rankings-based data. An optional advanced module called CVA/HB is available for hierarchical Bayes (HB) estimation, which has consistently been shown to obtain slightly better results.
CVA may also be used to analyze traditional full-profile conjoint data not designed or fielded using Sawtooth Software's tools. You may import designs and respondent data into the CVA system for subsequent analysis using the utility calculation and market simulation tools.
Sawtooth Software's market simulator is shared across our four conjoint systems. The market simulator lets the researcher specify a market consisting of several products defined in terms of attribute levels, and then estimate the shares of preference that each product would receive. If you have used single-concept presentation (described later) and purchase likelihood ratings, then the market simulator can be used to estimate purchase likelihood for product profiles.
Question Formats
Pairwise Presentation
The default questionnaire layout in CVA is Pairwise Comparison. With pairwise presentation, respondents are asked to compare two products, as shown below:
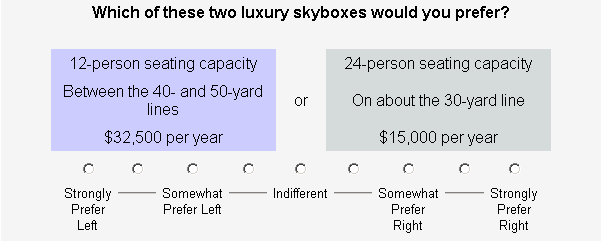
When respondents compare two products side-by-side, it can help them draw finer distinctions between products offering different features. However, if two products are shown per question, respondents must evaluate twice as much information as single concept designs (described below). We suggest the pairwise design for most CVA conjoint projects.
Single Concept Presentation
Single concept presentation is commonly known as "card-sort." Respondents can be shown one product at a time and asked to rate how likely they would be to purchase each. An example is shown below:
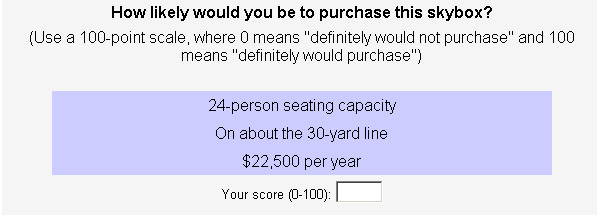
This method is useful if the "purchase likelihood model" is to be used in the simulator. CVA's ordinary least squares (OLS) routine is appropriate for analyzing single concept ratings. Hierarchical Bayesian (HB) estimation may also be used with single concept ratings.
Alternatively, each of a set of product profiles can be printed on individual cards, and respondents can be asked to sort the cards from most to least preferred. In this case, the responses are rank orders of preference, and CVA's monotone regression routine is suggested for developing utilities.
Evidence to date suggests that either questionnaire technique (pairwise or single-concept) produces quite similar relative part-worths and importances.