Creating a Sawtooth Software Account
If you aren't already registered to use Lighthouse Studio with a Sawtooth Software Account, the first time you launch the software (Start | Programs | Sawtooth Software | Sawtooth Software Lighthouse Studio) you are shown a dialog wherein you specify your Email and a Password and click Create New Account. After creating the account you will receive an email asking you to confirm account creation by following the link in the email. Once your account is confirmed, return to the software to Sign in.
When signed in to your Sawtooth Software Account you will see your account email address at the upper-right hand side of the application. You can click on that link to view your license information, go to your account online, or sign out.
What is Lighthouse Studio?
Lighthouse Studio is a platform for creating questionnaires. These questionnaires can include standard survey questions, such as "What is your primary occupation?" or "How many people live in your household?". Other studies may include specialized research techniques such as Maximum Difference Scaling (MaxDiff) and conjoint (trade-off) analysis, including Choice-Based Conjoint (CBC), adaptive Choice-Based Conjoint (ACBC), CVA (traditional full-profile conjoint), and Adaptive Conjoint Analysis (ACA). The standard survey and conjoint questions are integrated within the same continuous survey. CBC, ACBC, MaxDiff, CVA, and ACA are just specialized components within Lighthouse Studio.
Lighthouse Studio is a locally installed (Windows) system for composing, fielding, and managing surveys over the Internet or via CAPI. It includes standard surveying capabilities as well as conjoint analysis components. |
This 45-minute tour focuses on general surveys rather than conjoint analysis. Even if your primary intent is to use Lighthouse Studio for its conjoint capabilities, you should find this tour useful as we cover many topics that are essential to all surveys, whether including conjoint questions or not.
The Big Picture
Lighthouse Studio should be installed onto your own desktop computer. (You can install a demo version of Lighthouse Studio from http://www.sawtoothsoftware.com/downloads ). Lighthouse Studio provides a simple point-and-click interface for writing questionnaires and testing them—all on your own computer. For example, you can make sure that any skip patterns, randomizations, and question verification (such as whether respondents filled out all the required questions on a page) are working properly on your desktop PC.
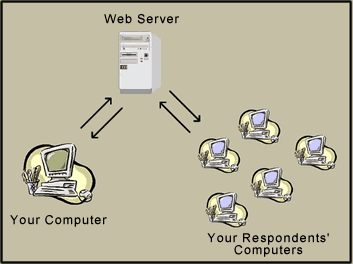
Most users will take advantage of Sawtooth Software's free survey hosting services offered with subscription licenses. However, advanced users may decide to field Lighthouse Studio projects on their own internet servers.
NOTE: You should NOT install the full Lighthouse Studio on a Web Server.
After you finish writing your questionnaire on your PC, you just need to upload the project to the Web Server. This Web Server can be your own company's server, our servers (if you use our hosting service), or a server that you "rent" from a third party provider, such as an ISP (Internet Service Provider). By the way, we don't charge you any per-project or per-respondent interviewing fees if you use your own or a "rented" server. You are free to interview as many people (who browse/connect to the Web Server) and conduct as many projects as you like.
For more information on how to upload your survey to a web server see: Hosting Management
Starting a New Lighthouse Study
From this point on, we'll assume you have installed Lighthouse Studio on your computer. (You can install a demo version of Lighthouse Studio at http://www.sawtoothsoftware.com/downloads).
Start Lighthouse Studio by clicking Start | Programs | Sawtooth Software | Sawtooth Software Lighthouse Studio. If you are starting the system for the first time, Lighthouse will ask you if you want to start a new study (otherwise, click File | New Study or click the New icon on the toolbar.) Go ahead and start a new study, with a studyname no longer than twenty-four characters long (e.g. "mydemo"). Note that this name appears in the browser's address field and in files you use on the internet, so you probably shouldn't use words that reveal something about your project that you wouldn't want revealed, such as your client's name.
Next, choose a folder on your device's local drive to store your project. Browse to the folder (by clicking the Browse… button) and (if needed) create a new folder using the Make New Folder button on the dialog. Finally, select what type of study to create. For the purposes of this tour, select MyStudy.
When you start a new study (or open an existing study), the main menu is shown:
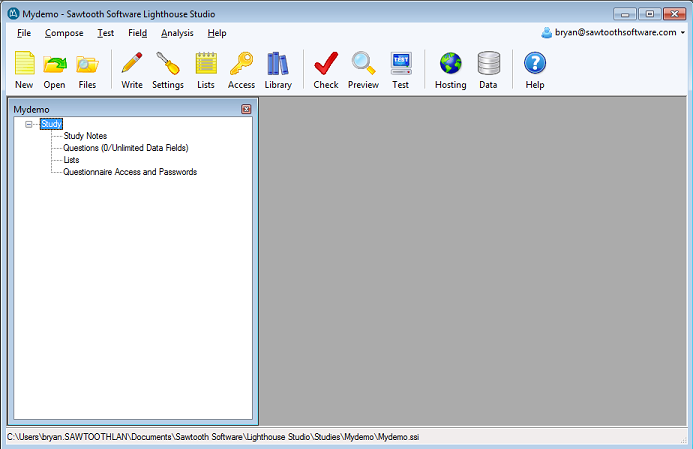
The first thing you should know is that while at any screen in Lighthouse Studio, you can press F1 to receive help related to the items on that screen. You can also receive help by clicking Help from the main menu and then by choosing Lighthouse Studio Help… or alternatively by clicking the ? button on the toolbar.
Writing a Simple Survey
From this point onward, we'll assume you've installed Lighthouse Studio and created a new study on your local device. Let's consider a simple questionnaire:
Welcome to our survey! Today we are interested in ice cream preferences. Please type your user name and password and then click the "Next" button to continue… -------------------------------------<Page Break>---------------------------------------
Q1. Please tell me how often you typically eat ice cream…
O Never O Rarely O Sometimes O Often -------------------------------------<Page Break>---------------------------------------
Q2. In the past week, how many times have you eaten ice cream?
______ times
Q3. Which of these flavors do you often eat? (Select all that apply) <Randomize list>
[ ] Chocolate [ ] Rocky-Road [ ] Strawberry [ ] Peach [ ] Vanilla [ ] Neapolitan
-------------------------------------<Page Break>---------------------------------------
Q4. Please describe the last occasion in which you ate ice cream…
-------------------------------------<Page Break>---------------------------------------
Thank you very much. That's all we need to know today. |
To write this survey, click Compose | Write Questionnaire... (or click the Write icon on the toolbar). The Write Questionnaire dialog is shown:
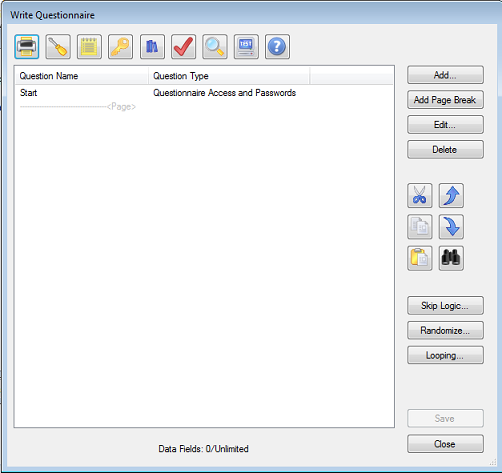
The panel displays the list of questions that are currently in your survey. Lighthouse Studio automatically adds a Start "question" on the first page of your survey. Oftentimes, when you provide a survey link to launch the questionnaire, this Start "question" is actually not seen by the respondent and is used instead for specifying passwords and other related settings.
To modify the Start question, highlight it within the List of Questions using the mouse and click the Edit… button (or double-click the question).
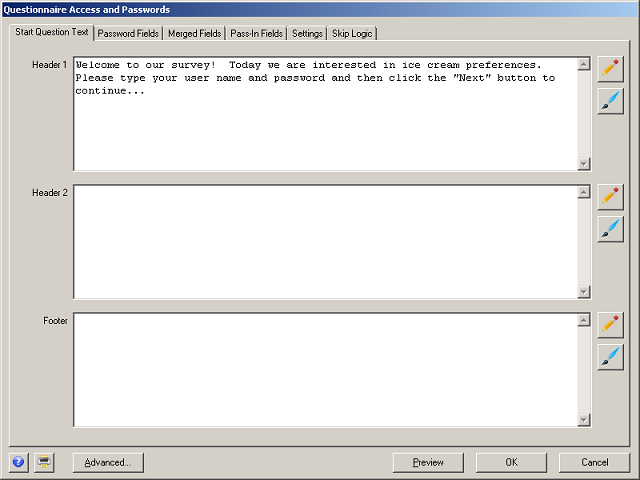
The Questionnaire Access and Passwords dialog is shown:
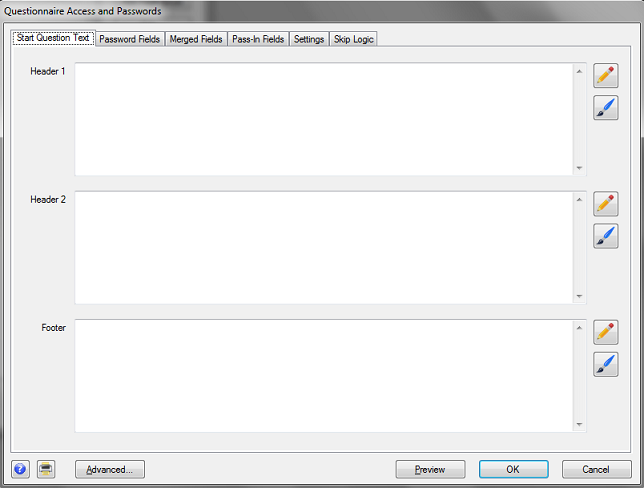
This dialog lets you specify what the respondent sees on the first page of the survey and also lets you specify respondent passwords if you want to include passwords in your survey.
Each question has different text areas where you can directly type text to show on the screen (and optional HTML). The three main areas for the introductory Start question are:
| • | Header 1 |
| • | Header 2 |
| • | Footer |
These text areas are arranged on the browser screen (if you were to preview the question) as:
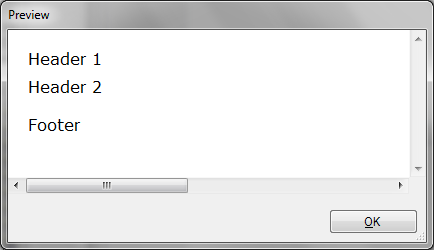
"Header 1" "Header 2" and "Footer" provide an easy way for you to type information and have these sections separated by a blank line. Let's add the introductory text for our ice cream questionnaire. Within the "Header 1" field, type the text:
Welcome to our survey! Today we are interested in ice cream preferences. Please type your user name and password and then click the "Next" button to continue…
|
Note that you can directly type the text into the "Header 1" entry field, or you can click the ![]() "Pencil" icon to open a larger window for typing/editing text.
"Pencil" icon to open a larger window for typing/editing text.
After you have done this, the dialog should look like:
Create User Names and Passwords
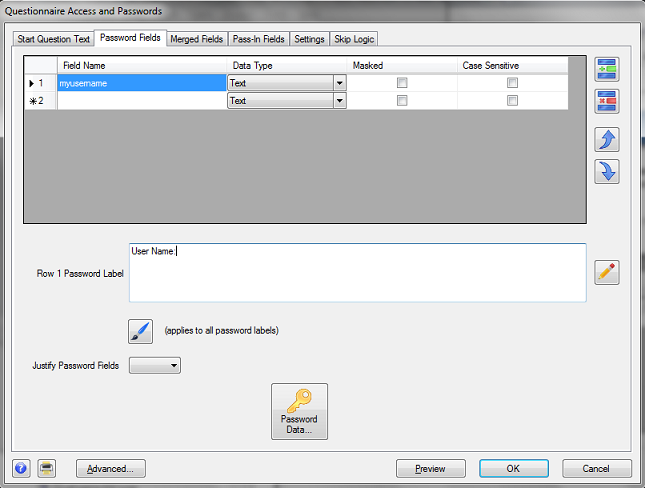
We want to establish usernames and passwords for respondents in this study (it is optional to set up passwords for respondents). While editing the Start question, click the Password Fields tab. The table on this tab is where you specify any passwords respondents must specify prior to accessing the survey. You can add many password fields, but it is typical to include just one or two password fields. In our survey, we'll be using a username and a password. We'll name the variables (fields) myusername and mypassword.
Edit the first row of the table, inserting the name of the password variable (myusername) in the first column. If you want the text to appear as dots when respondents type (to mask their password so that others viewing the screen cannot read what is typed), click the Masked box. If you want the passwords to be case sensitive (so that respondents have to use capital and lower case letters exactly as specified), then click the Case Sensitive box.
Specify the text that you want shown next to the myusername entry box in the Row 1 Password Label area. We'll use the text "User Name:". When you have finished supplying the settings for the myusername password variable, the table looks like:
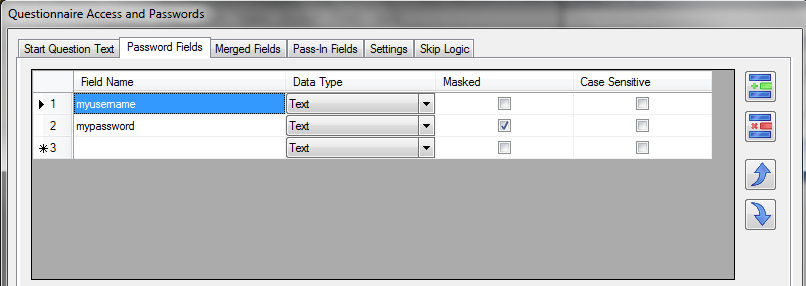
To add a new password variable, type mypassword in the second row of the table. Let's mask mypassword when respondents type in their password, by clicking the Masked box in the second row of the table. Let's also add the label: "Password:" in the Row 2 Password Label field. After you've specified the mypassword row in the table, it should look like:
Next, click the Preview button at the bottom of the dialog.
A small browser window opens to give a representation of what this question would look like to your respondents. If you send the login link to respondents, they would see the Start question as follows:
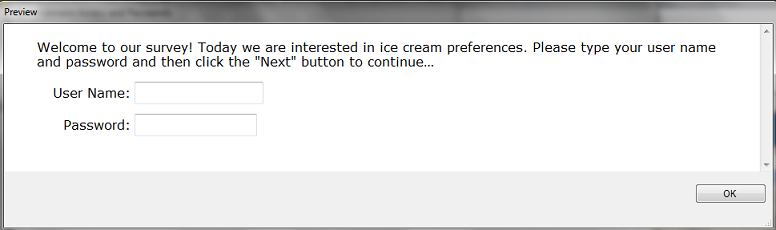
A common approach is to provide respondents a "one-click link" which already includes the respondent's password in the link (the URL), so that respondents just click the link and immediately bypass the Start question and begin the survey at the question directly following the Start question. But, for this quick-start tutorial, we'll assume you are sending a generic link to the Start page for each respondent.
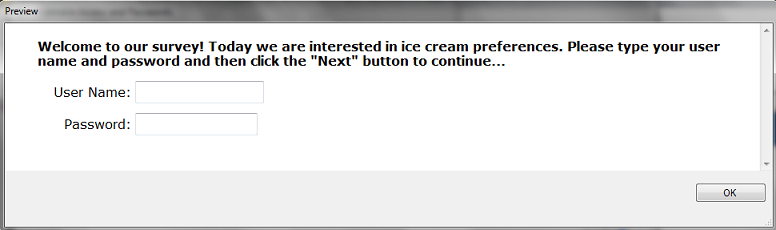
Perhaps we would prefer to bold the text in the opening paragraph. Click OK in the Preview window to retire that window. Click the Start Question Text tab. To the right of the "Header 1" field, click the "paintbrush" icon ![]() , use the drop-down box to change bold to "Yes" (to override the existing style settings for this question) and click Preview. The question now appears as:
, use the drop-down box to change bold to "Yes" (to override the existing style settings for this question) and click Preview. The question now appears as:
(Alternatively, for those that know some HTML, you could have enclosed the text you typed into the Header 1 field within <b></b> tags to accomplish the same effect.)
Most surveys use a unique user name/password for each respondent. For simplicity sake, we'll use a single User Name and Password combination for all respondents in this practice survey.
From the Questionnaire Access and Passwords, Password Fields tab, click the Password Data... icon:

First, you are asked if you'd like to save your work so far. Click Save and Continue. A table opens that looks a bit like a spreadsheet. This table displays the contents of your passwords file. Edit this table to add a User Name of "sawtooth" and a Password of "software" with 1000 total respondents allowed to use that password. When finished, the screen should look like:
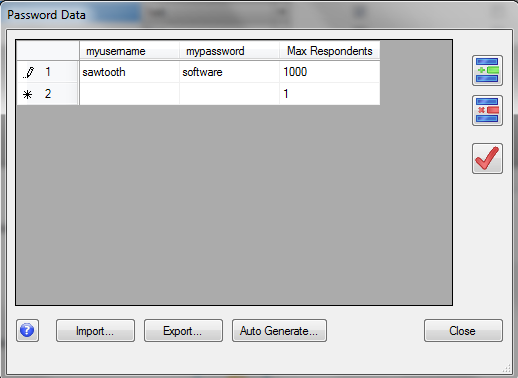
Earlier, when we first created the two password field variables, we had specified that the username and password were not case sensitive, so respondents can access the survey by typing "sawtooth" and "software" with either upper- or lower-case letters.
Each time you add a new row (a new myusername and mypassword combination), an empty row appears at the bottom of the table. A million or more password combinations could be specified, if needed. You can Auto-Generate... many random password combinations, or you could Import... password information from an existing text file.
For simplicity sake, we have allowed 1000 respondents to use the same password combination. In most studies, each respondent receives a unique password combination (Max Respondents=1). With unique passwords for each respondent, respondents that terminate early can return and restart the survey where they left off.
Adding Questions
Now let's add question 1. Click Close to close the passwords file and click OK to close the Questionnaire Access and Passwords dialog to return to the Write Questionnaire screen. The question to be added is:
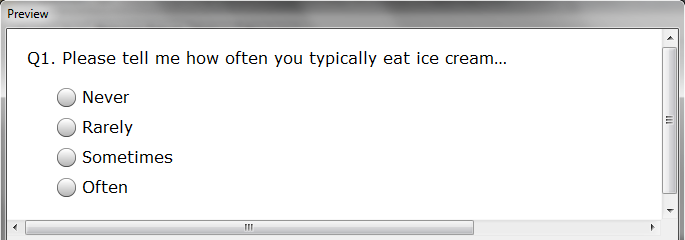
Q1. Please tell me how often you typically eat ice cream…
O Never O Rarely O Sometimes O Often
|
Whenever you add a question to the List of Questions, the new question is placed directly below whatever question (or page break) is highlighted. If no question is highlighted, then the new question is placed at the bottom of the list. If you want to rearrange the questions within the list, you can highlight them and use the "Up" and "Down" arrows next to the list. Or, you can cut, copy and paste questions by using the cut, copy and paste icons.
We want the first question to appear below the first page break. Highlight the page break on the list of questions, then click the Add… button. The Add to Questionnaire dialog is shown:
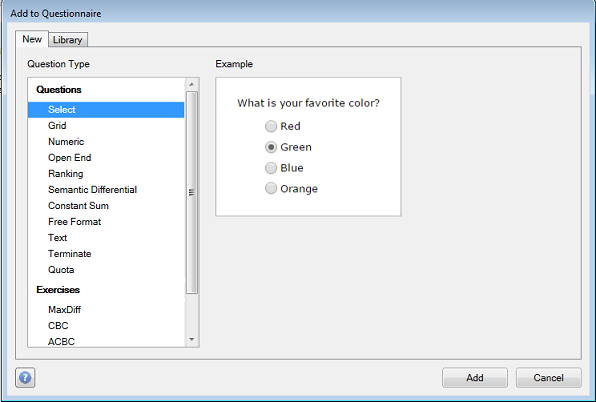
First, choose the question type from the radio buttons shown. This is a "Select-type" question, so highlight Select and click Add. Next, specify a name for the question in the Name field. Type "Q1" and click OK.
The Select Question dialog is displayed:
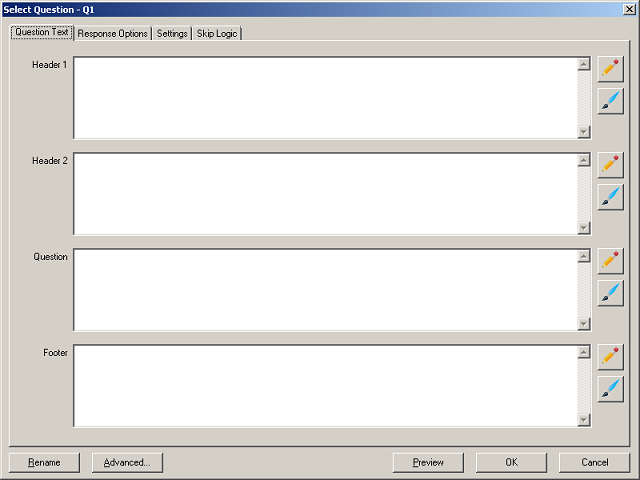
This question requires just a single response (a radio button), so you should click the Settings tab and select Radio button (single response) in the upper-left hand corner of this dialog (it is already selected by default).
Back on the Question Text tab, in the Header 1 Text field, type:
Q1. Please tell me how often you typically eat ice cream…
|
Next, let's specify the response options:
O Never O Rarely O Sometimes O Often
|
Click the Response Options… tab. On the Response Options tab, click Add... and type the first response "Never". Press the ENTER key twice and type the next item "Rarely." Repeat for "Sometimes" and "Often."
(Time-Saving Hint: Many users already have their questionnaires prepared in Microsoft Word. You can directly cut and paste a list of response options by highlighting the array of items in Microsoft Word or Excel, pasting to the clipboard using Ctrl+C or the Copy button in Microsoft Word or Excel (or another text editor), and then (within Lighthouse Studio) by clicking the Paste list member(s) from the clipboard icon ![]() .)
.)
Click OK to return to the Select Question dialog and click Preview: Your question should look like:
Click OK to return to the Write Questionnaire dialog.
We hope by now you are starting to get a feel for adding questions to your survey. We won't give you click-by-click details for the next three questions. Instead, we'll give you some bullet-pointed suggestions.
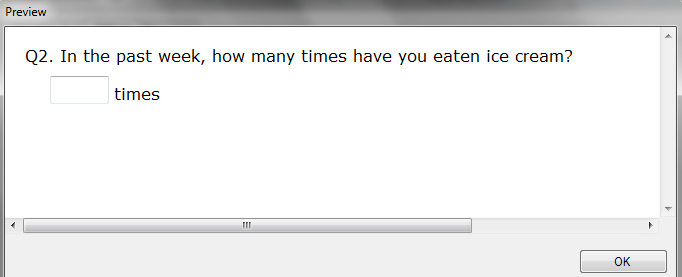
Q2. In the past week, how many times have you eaten ice cream?
______ times
|
| • | This is a "Numeric" question |
| • | Type the "times" label in the Question text area |
| • | From the Settings tab, specify a Minimum value of 0 and Maximum of 24 |
•From the Settings tab, specify to position the question text ("times") Right of input box.
When you are done and click Preview, the question should look like:
Next comes Q3:
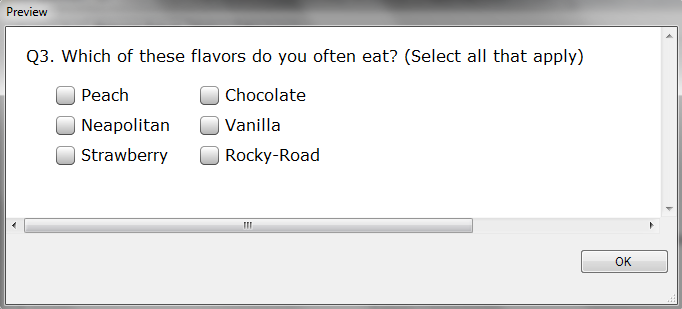
Q3. Which of these flavors do you often eat? (Select all that apply) <Randomize list>
[ ] Chocolate [ ] Rocky-Road [ ] Strawberry [ ] Peach [ ] Vanilla [ ] Neapolitan
|
| • | This is a "Select" type question |
| • | From the Settings tab, choose Check Box (multiple response) |
| • | Also from the Settings tab, for Number of Columns, specify 2 |
| • | When at the Response Options tab, make sure to click Randomize Response Options |
When you are done, click Preview and the question should look like (notice the randomized order):
Next comes Q4:
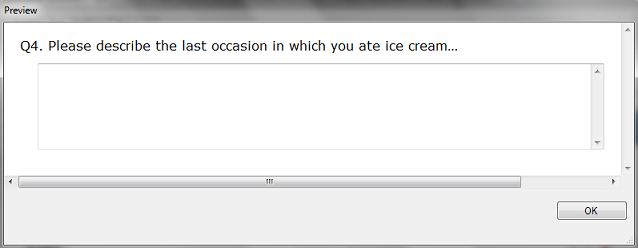
Q4. Please describe the last occasion in which you ate ice cream…
|
| • | This is an "Open-end" type question |
When you are done, click Preview and the question should look like:
The final part of the survey is a sign-off screen thanking respondents and letting them know they are done. This really isn't a "question" in the sense that it doesn't require a response, but for the purposes of adding it to the list, Lighthouse considers it a Terminate "question":
Thank you very much. That's all we need to know today.
|
| • | This is a "Terminate" type question |
| • | You can name the question "Finish" |
When you are done and click Preview, to see what the Terminate screen will look like.
Page Layout and Skip Patterns
While you were inserting questions into your question list, you may have also been adding page breaks by clicking the Add Page Break button from the Write Questionnaire dialog. If you have not already added page breaks between questions, we are ready to divide them into separate pages and add any skip patterns.
Go to the Write Questionnaire dialog. Note that the Start question is on Page #1. If you haven't already inserted page breaks, all other questions are on Page #2. The original questionnaire instructions called for:
| • | Q1 to be followed by a page break |
| • | Q2 and Q3 on the same page |
| • | Q4 on its own page |
| • | The termination screen at the very end, on its own page |
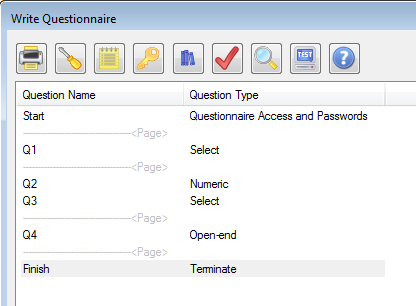
This is easy to accomplish. With the mouse, highlight Q1 on the question list, then click Add Page Break. Add a page break after Q3 and Q4. When you are done, your question list should look like:
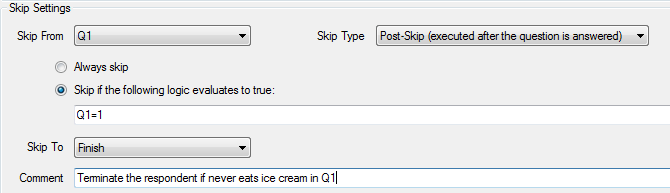
Now for the skip pattern. We know that if respondents answer item 1 (never eat ice cream) in Q1, they should be terminated. We therefore want to set a skip pattern with the following logic:
From Q1, Skip To Finish If Q1=1
To do this, from the Write Questionnaire dialog, click Skip Logic…. The Page Skip Logic dialog is shown. Click Add to add a skip instruction. Fill this next screen out as follows:
For simplicity sake, we only have created one terminating page both for people who disqualify (eat no ice cream) and those who complete the survey fully. You could include multiple terminating points and mark records that terminate as Qualified or Disqualified, or even assign "disposition numbers" to track respondents who terminate at various points in the questionnaire.
Now that we have added our questions to the study, added page breaks, and defined skip logic, let's preview our questionnaire.
Previewing the Questionnaire
We have already shown you how to preview each question one at a time. We'll now show you how to preview the entire survey. At the Write Questionnaire dialog (accessed from the main menu by clicking Compose | Write Questionnaire or by clicking the ![]() "Pencil" icon), click the "Preview" icon
"Pencil" icon), click the "Preview" icon ![]() .
.
When you click Preview, you can choose what to preview. Choose Preview Questionnaire from Page 1. A browser window automatically opens page 1 for your review. In the background, Lighthouse has created a Temp folder inside your study folder on your device's local drive and written separate static HTML pages to that folder named TempWeb1 through TempWeb5 (you have 5 pages in this questionnaire). These files are linked one to another by the Next button, for your convenience, so you can browse from page to page by just clicking the Next button. Another convenient way to preview the questionnaire (or share the questionnaire with colleagues) is to save the survey to a single HTML file or PDF-format file. Click File | Print Study to print the study in either of these formats (select Graphical View and click Print to File).
Note: The Preview Survey mode is just for preview purposes only—no data are stored and no skip patterns are executed.
Test Running Your Survey Using "Local Test Server"
Although the Preview Survey function is nice, you generally will want to test your survey in runtime mode with any skip patterns, response verification, and randomizations in place. You could upload your files to the Web Server (e.g. Sawtooth Software's hosting service), but Lighthouse Studio provides a more convenient way to test run your survey locally on your PC or laptop.
Local Test Server
From the Write Questionnaire dialog, Click the Test Survey button ![]() .
.
Your browser opens up the first survey page. Enter your User Name (SAWTOOTH) and password (SOFTWARE) and click the Next button. This is your survey, as it would appear to a respondent over the Internet (there are slight visual differences from browser to browser).
To close the survey, simply close the browser window (using the X in the upper-right hand corner). To run the survey again, click the Test Survey button ![]() .
.
Go ahead and take a survey or two, as we'll need the data for a later section of this tour.
Adding Polish and Style
You have probably noted that the survey we've created is pretty bland looking. We can add some polish and style by clicking the Survey Settings icon ![]() from the Write Questionnaire dialog (or by clicking Compose | Survey Settings from the main menu).
from the Write Questionnaire dialog (or by clicking Compose | Survey Settings from the main menu).
First, let's select a style from the Styles tab. Select a style you wish to use and click Use Selected at the bottom of the dialog to implement the style. We'll select Panama as the style, but you might want to experiment with other styles.
On the General Settings tab, you can select to use graphical Submit, Previous, and Select/Checkbox buttons. A library of buttons is provided, available in the C:\Program Files\Sawtooth Software\Lighthouse\graphics folder.
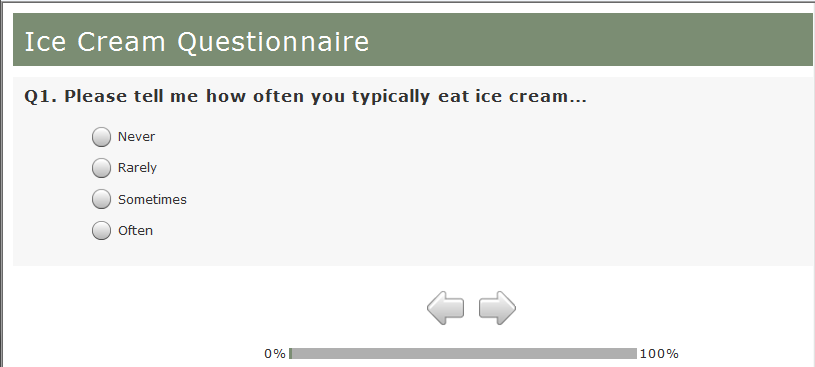
On the Headers and Footers tab, you can specify a Header and a Footer. We'll specify Ice Cream Questionnaire as the header text.
The Progress Bar tab lets you add a progress bar to your survey. We'll click the check box to add a progress bar to the page footer (it's on by default).
When you go back and test run the survey, your survey should have a bit more polish. Under Panama style, our survey now looks like:
The Admin Module
When you eventually upload your project to your Web Server (or our servers if using our web hosting service), an administrative area is available for you. You can access this administrative area from any computer connected to the Web. You protect this area using a password, so that others cannot access your survey settings or the survey data. You may change the password under the Field | Hosting Management dialog.
With the Admin Module, you can…
| • | Check how many completed records you have |
| • | View/Edit respondent data |
| • | Tabulate responses for questions |
| • | Download data to your device's local drive |
| • | Reset survey (delete all data and start fresh) |
| • | Download passwords for respondents who have completed/not completed |
In this tour, we'll just cover downloading data, but we encourage you to investigate the other options within the Admin Module.
Running the Admin Module
From Lighthouse Studio's main menu, click Test | Admin Module. The Admin Module appears just as it would over the Web, but we are only working with files and data locally on your device's local drive.
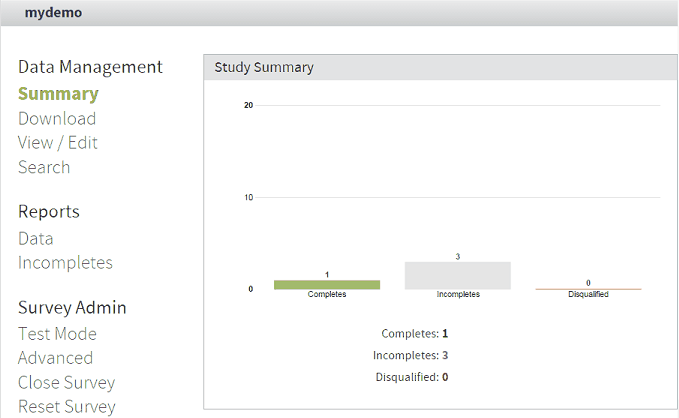
Downloading Data
Downloading data copies the respondent records to a .csv file to a destination folder (such as your device's local drive). You can do this from the Admin Module by clicking Download. In that case, it will ask you to browse to your study folder on your device's local drive. You may download data that way, but it is easier to do it from within Lighthouse's interface (since you don't have to browse to your study folder). From within Lighthouse Studio, click Test | Download Data. You are informed that the test data were successfully downloaded. (This step also accumulates the data into your Lighthouse Studio project.)
Exporting (Converting) Data to Excel(TM) Format
After you have collected data and downloaded the respondent records to your device's local drive, you typically will want to convert the data to a common format for analysis. Lighthouse can convert the data (and labels) to SPSSTM, ExcelTM or text-only formats. For this tour, we'll just use the .CSV format which may be opened using Excel.
If you haven't already done so, close the browser window for the Admin Module and return to the main Lighthouse Studio menu. Click File | Data Management (or click the Export Data icon ![]() ) and the Data Management dialog is shown:
) and the Data Management dialog is shown:
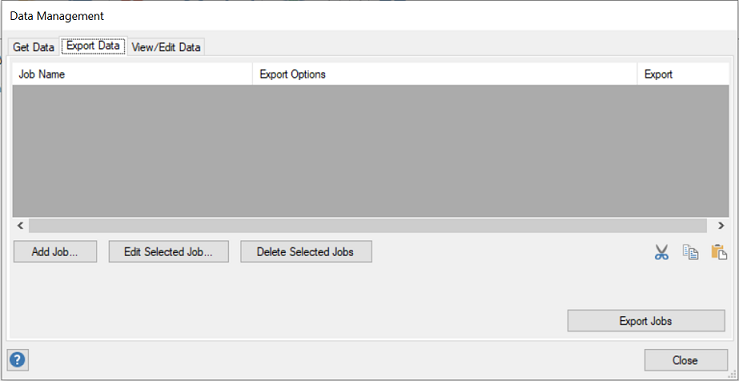
You export data from Lighthouse using Export Jobs. If you are exporting the data in multiple ways (such as for multiple clients), you may wish to set up and save a different job for each client. Click Add job... to add an export job. the Export Job dialog is shown. Specify a name for the job, such as ExportAll.
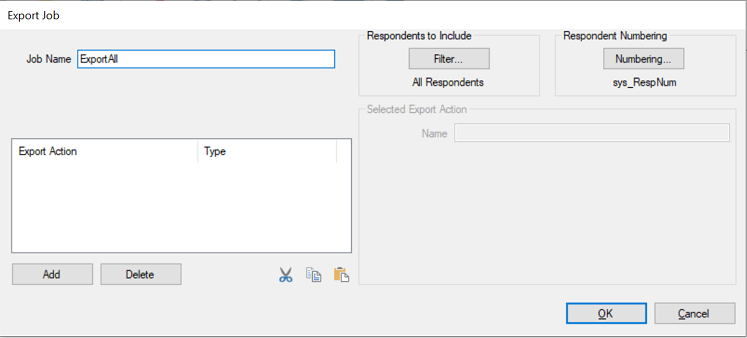
The Respondents to Include control lets you choose which respondents to include. Respondent Numbering lets you specify the variable to use for the CaseID. The File Formats control lets you specify the type of file to export (you may select from .csv, Excel, SPSS, and Tab/Lay). The Export Fields lets you choose which variables to export. There are other settings that we won't cover in this short tutorial.
For this example, we'll just use the default settings. Click OK to return to the previous dialog and then click Export Jobs.
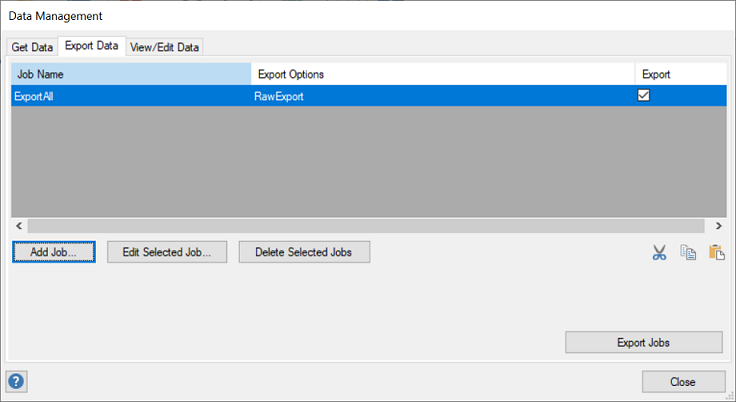
After the job(s) are exported, you'll see a list of folders you can open that contain the exported files. You can directly open the folders from this dialog, or you also can browse to them on your local drive within your project folder (don't forget the handy Explore Study icon ![]() on the tool menu that automatically explores your study folder). When you open the file you exported, it's likely that a program such as Excel will open the .CSV file containing your exported data. If you don't own Excel, the .csv file may be opened using Notepad or another simple text editor.
on the tool menu that automatically explores your study folder). When you open the file you exported, it's likely that a program such as Excel will open the .CSV file containing your exported data. If you don't own Excel, the .csv file may be opened using Notepad or another simple text editor.
Here are our results (yours will be different):
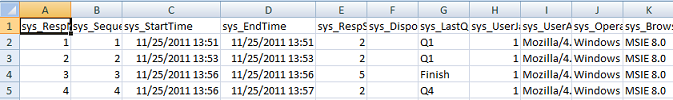
If we scroll to the right, we find the responses to the questions Q1 through Q4.
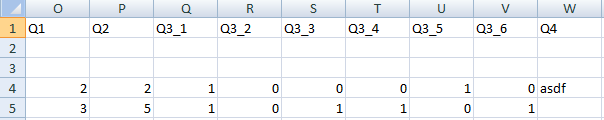
Responses for Q1 and Q2 are quite straightforward. Q1 was a single-select question and the first complete respondent (listed on row 4 of the spreadsheet) answered with the second response option (coded as a "2").
The second completed respondent (on row 5) clicked the third option for Q1 and typed a 5 for Q2 (how many times eaten ice cream in last week). Q3 is a multiple-response (check box) question. This respondent checked the first, third, fourth, and sixth items (a "1" indicates checked and a "0" indicates not checked). Lighthouse Studio automatically unscrambles the random order and presents it here in the natural order you specified when you created the survey.
Adding Graphics
As a last point, we'd like to show you how easy it is to add graphics to your survey. The typical kinds of graphics files you use for web surveys are in .GIF, .PNG, or .JPG format.
You may recall that in Lighthouse Studio, most any place that you provide survey text, there is also a ![]() "Pencil" icon, which opens up a larger Window for typing text. This larger window also includes a toolbar, as shown below:
"Pencil" icon, which opens up a larger Window for typing text. This larger window also includes a toolbar, as shown below:
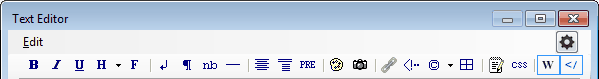
For example, this toolbar helps you bold (B), italicize (I), or Underline (U) text within your survey (using the toolbar buttons automatically insert HTML instructions, which browsers know how to interpret to create the desired effects).
You can use the toolbar to add graphics. Place your cursor at the place in your text at the place which you wish a graphic to show. Then, click the ![]() "camera" icon. A dialog appears that asks you to type a file name or browse to find the graphic to add to the survey. Type the name, or browse to the file and click the Open button to insert the graphic. Special HTML instructions are added to your text to tell the browser what file to display and where to find it on the server.
"camera" icon. A dialog appears that asks you to type a file name or browse to find the graphic to add to the survey. Type the name, or browse to the file and click the Open button to insert the graphic. Special HTML instructions are added to your text to tell the browser what file to display and where to find it on the server.
When you preview or run the questionnaire using Local Test Server, the graphic is displayed. (Make sure to keep your graphics small, as large graphics files can take a long time to show for respondents with slow connections. Typical graphics sizes for surveys are about 20KB or smaller.)
Conclusion
This quick tour has only touched on the basics. We encourage you to search the online help, or to print out the complete documentation. And of course, if you have any questions, you can contact us at +1-801-477-4700 or write us at support@sawtoothsoftware.com. We are available Mon-Fri, during our business hours (Mountain Time Zone).