Creating a Sawtooth Software Account
If you aren't already registered to use Lighthouse Studio with a Sawtooth Software Account, the first time you launch the software (Start | Programs | Sawtooth Software | Sawtooth Software Lighthouse Studio) you are shown a dialog wherein you specify your Email and a Password and click Create New Account. After creating the account you will receive an email asking you to confirm account creation by following the link in the email. Once your account is confirmed, return to the software to Sign in.
When signed in to your Sawtooth Software Account you will see your account email address at the upper-right hand side of the application. You can click on that link to view your license information, go to your account online, or sign out.
Introduction
This tutorial leads you step-by-step through a simple CBC study, from thinking about a marketing problem, planning a questionnaire and creating a new study in Lighthouse Studio, to entering a list of the attributes and levels, generating the questionnaire and analyzing the results.
Lighthouse Studio is a powerful program and this tutorial only touches on the basics. You'll become aware of different or more sophisticated approaches by reading other sections in this manual, by viewing on-line help and by experimenting with Lighthouse Studio.
We also suggest the following two articles, available within our Technical Papers Library at http://www.sawtoothsoftware.com/support/technical-papers: "CBC Technical Paper" and "Getting the Most from CBC."
(Note: this example and the data presented are purely fictional. The suggested steps represent one approach to this type of marketing problem, but may not necessarily reflect the single "best" way to conduct such a research study using Lighthouse Studio.)
The Marketing Problem
You have been hired as a consultant to a little-known startup company called Performance Plus. The brilliant design engineers at Performance Plus have developed a golf ball that flies farther than average balls. The proposed name for the ball is "Long Shot." Because Performance Plus is not well known among golfers, your client has considered approaching a well-known maker of golf clubs and balls (Golfers, Inc.) to market the ball using their existing brand name for balls: "Eclipse." Sales for Eclipse have been declining and they welcome the opportunity to benefit from the new technology. A line extension brand called "Eclipse+" has been proposed. However, the royalty Golfers, Inc. is proposing seems high.
Two other manufacturers already offer high performance balls: High-Flyer Pro (by Smith and Forester), and Magnum Force (by Durango). High performance balls command a price premium of between 20% to 50% over traditional balls and the market is growing rapidly.
One day between rounds of golf with the president of Performance Plus (you gracefully lost), you jointly draft up the following questions on the back of your score card.
1) How well could Long Shot by Performance Plus hope to compete with existing competitors Smith and Forester and Durango in the high performance ball market?
2) Should Performance Plus form an alliance with Golfers, Inc.? How much incremental value does the Golfers, Inc. brand name "Eclipse" add?
3) How do golfers trade off performance vs. price for high performance balls?
4) How should "Long Shot" be manufactured and positioned in terms of performance and price to maximize profitability?
5) Do novice or experienced golfers differ in their preferences for high performance golf balls? Could this lead to a target market strategy?
Defining a List of Attributes and Levels
One of the first steps in using any Conjoint technique is to define the problem in terms of attributes and levels. Back at the office, you review the points written on the back of the score card, and you write down the following:
Brand:
High-Flyer Pro, by Smith and Forester
Magnum Force, by Durango
Eclipse+, by Golfers, Inc.
Long Shot, by Performance Plus
Performance:
Drives 5 yards farther than the average ball
Drives 10 yards farther than the average ball
Drives 15 yards farther than the average ball
Price:
$4.99 for package of 3 balls
$6.99 for package of 3 balls
$8.99 for package of 3 balls
$10.99 for package of 3 balls
Each of these levels is mutually exclusive; golf balls are described using a single level from each attribute. The range of the attributes is based on technical specifications that Performance Plus has given you. As for prices, your research suggests that the two competitors are currently selling packages of three balls for between $7.99 to $10.99. You select a wider range to cover the price levels you are interested in, but don't consider any prices below $4.99, having determined that such a low price cannot cover the manufacturing and marketing costs and result in a profit.
A Study Plan and Sample Scripted Questionnaire
Now that you have formulated some attributes and levels, you begin to think about the rest of the questionnaire, and plan a design and field strategy.
You decide to invite golfing enthusiasts (by email) to visit a site on the web and take a CBC survey. You've purchased an opt-in list from a reputable sample provider. Each of the participants who complete the survey will be entered into a drawing for a free set of golf clubs from a leading manufacturer.
You have scripted the following introductory text screens and questions in your word processing package:
Start:
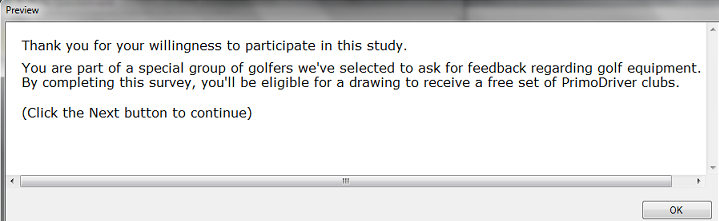
Thank you for your willingness to participate in this study.
You are part of a special group of golfers we've selected to ask for feedback regarding golf equipment. By completing this survey, you'll be eligible for a drawing to receive a free set of PrimoDriver clubs.
(Click the Next button to continue)
|
Frequency:
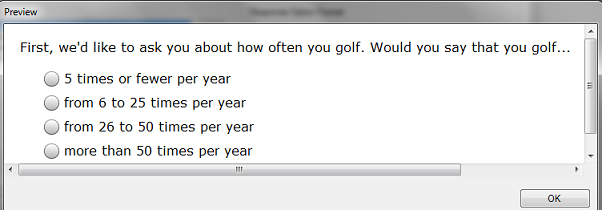
First, we'd like to ask you about how often you golf. Would you say that you golf...
m 5 times or fewer per year m from 6 to 25 times per year m from 26 to 50 times per year m more than 50 times per year
|
Skill:
We'd like to get a feel for your skill level. Over the last year, what was your best score on a par-72, 18-hole course?
m 120 strokes or more m Between 100 and 120 strokes m Between 85 to 100 strokes m Above par, but lower than 85 m At or below par (72 or lower)
|
Venue:
Do you usually golf at...
m Public courses m Private courses |
IntroCBC:
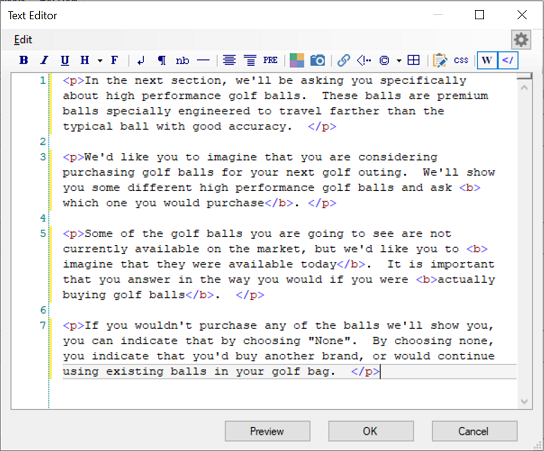
In the next section, we'll be asking you specifically about high performance golf balls. These balls are premium balls specially engineered to travel farther than the typical ball with good accuracy.
We'd like you to imagine that you are considering purchasing golf balls for your next golf outing. We'll show you some different high performance golf balls and ask which one you would purchase.
Some of the golf balls you are going to see are not currently available on the market, but we'd like you to imagine that they were available today. It is important that you answer in the way you would if you were actually buying golf balls.
If you wouldn't purchase any of the balls we'll show you, you can indicate that by choosing "None". By choosing none, you indicate that you'd buy another brand, or would continue using existing balls in your golf bag.
|
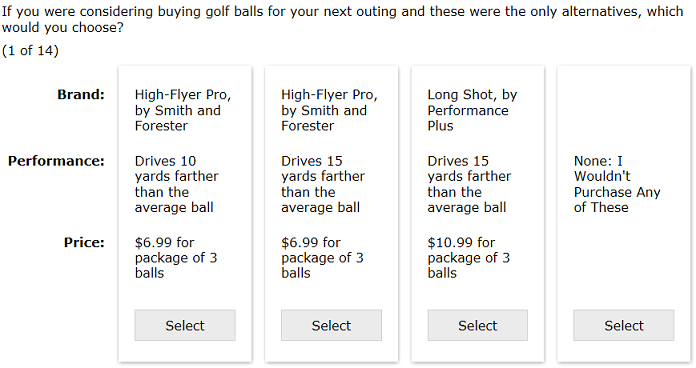
At this point in the questionnaire, you plan to ask the Choice-Based Conjoint questions (tasks). You want to measure preference for the different levels of the attributes and their impact on choice for high performance golf balls. To accomplish this, you decide to specify 14 CBC tasks (below is an example of one such task). The features will combine freely to form up to 48 (4 brands x 3 performances x 4 prices) different product offerings. Even though there are only 48 total possible product concepts in this relatively small design, there are thousands of different ways to display multiple product concepts at a time in choice sets.
Choice Task (one of 12 constructed tasks using a controlled randomization design strategy):
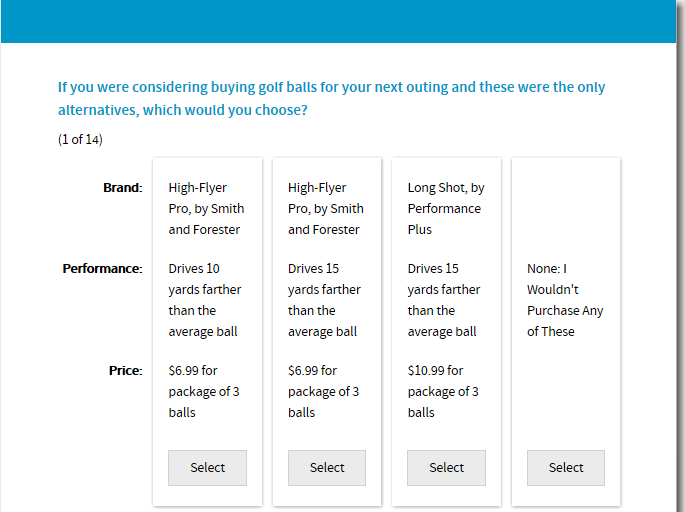
If you were considering buying golf balls for your next outing and these were the only alternatives, which would you choose?
High-Flyer Pro, by Smith and Forester
Drives 15 yards farther than the average ball
$10.99 for package of 3 balls |
Magnum Force, by Durango
Drives 15 yards farther than the average ball
$6.99 for package of 3 balls |
Eclipse+, by Golfers, Inc.
Drives 5 yards farther than the average ball
$6.99 for package of 3 balls |
None: I Wouldn't Purchase Any of These |
Even though these CBC tasks are called "random tasks," that term is easily misunderstood. Some people take it to mean that the composition of the questions is randomly (haphazardly) selected. This is not so. The questions are carefully chosen according to design principles of balance and independence (orthogonality). We call the tasks "random" because respondents are randomly selected to receive one of many carefully constructed, unique versions of the CBC questionnaire.
In addition to the random choice tasks, you also plan to ask two fixed "holdout" tasks that will be constant across all respondents. You plan to do this for three main reasons:
1) By doing some research on the Internet and at local golf stores, you have learned the performance specifications and average prices for the two existing balls on the market (High-Flyer Pro and Magnum Force). Your client has also given you a good feel for the product specifications they think could match up well with these two brands. Therefore, you and your client can imagine a specific potential product scenario you'd like to directly assess.
2) Your client has no experience with conjoint methods and seems a bit uncertain regarding the reliability and accuracy of the market simulator. Demonstrating that the market simulator can accurately predict responses to some holdout fixed scenarios which were likely never shown among the experimentally designed tasks should boost his confidence in the method.
3) You may want to test how well different part-worth utility analysis methods work for the study. You'd like to have a couple of "holdout observations" by which to compare the predictive accuracy of alternative solutions you might develop (note: in practice more than two holdout questions would be needed to identify reliably whether one part-worth utility model performs better than another in terms of predictive validity).
These fixed tasks will not be constructed experimentally (using the design algorithm), but are to be displayed exactly with the specific levels you assign. These two tasks will be asked as the 7th and 9th tasks. In total, you'll ask 12 random + 2 fixed = 14 tasks. In the first fixed holdout, you plan to show the relevant competition versus your client's offering with your client's brand name. In the second fixed task, you plan to show that same relevant competition versus the Eclipse+, by Golfers, Inc.
Here are those two fixed holdout concepts:
Fixed Holdout Task #1 (7th overall choice task):
If you were considering buying golf balls for your next outing and these were the only alternatives, which would you choose?
(7 of 14)
High-Flyer Pro, by Smith and Forester
Drives 15 yards farther than the average ball
$10.99 for package of 3 balls |
Long Shot, by Performance Plus
Drives 10 yards farther than the average ball
$6.99 for package of 3 balls |
Magnum Force, by Durango
Drives 5 yards farther than the average ball
$8.99 for package of 3 balls |
None: I Wouldn't Purchase Any of These |
Fixed Holdout Task #2 (9th overall choice task):
If you were considering buying golf balls for your next outing and these were the only alternatives, which would you choose?
(9 of 14)
Magnum Force, by Durango
Drives 5 yards farther than the average ball
$8.99 for package of 3 balls |
Eclipse+, by Golfers, Inc.
Drives 10 yards farther than the average ball
$6.99 for package of 3 balls |
High-Flyer Pro, by Smith and Forester
Drives 15 yards farther than the average ball
$10.99 for package of 3 balls |
None: I Wouldn't Purchase Any of These |
Notice that your client's offering is in the center position for both tasks, but the position of its competitors is rotated. The two fixed holdout tasks are separated by a random choice task so that respondents will generally not recognize that it is a repeated task with just one small difference (the brand name attached to your client's ball).
Lastly, you decide to ask about gender and income. These might prove useful as a respondent filter in analysis, for bench-marking versus future waves of research, or for future target/database marketing efforts.
Gender:
Are you..
m Male m Female m Refused
|
Income:
This is the last question in the survey. What is your total household income for the last calendar year, before taxes?
m Less than $30,000 m Between $30,000 and $60,000 m Between $60,000 and $100,000 m More than $100,000 m Refused
|
Signoff:
That completes our survey. Thank you very much for your input.
|
Now that you have developed a list of attributes and levels and scripted a rough-draft of your questionnaire and the design of the choice tasks, you are ready to create the study and compose the questionnaire.
Using Lighthouse Studio to Write the Questionnaire
Start by opening the Sawtooth Software Lighthouse Studio. If you have a standard installation, you start it by clicking Start | Programs | Sawtooth Software | Lighthouse Studio. CBC is one component within that software program. The next step is to open a new study and define a study name.
After starting Lighthouse Studio, choose File | New Study…. The New Lighthouse Study dialog appears, with your cursor active in the Name field.
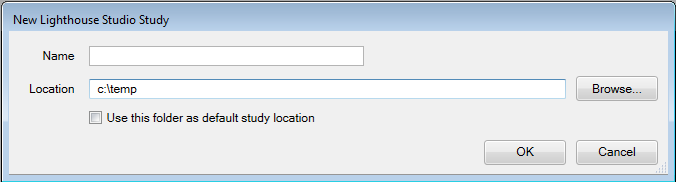
The Location field lists the folder (directory) that Lighthouse Studio currently is using to store studies. You can use any folder you like for this tutorial project. You can browse to and create new folders by clicking the Browse... button to the right of the Location field and then (after browsing to the folder in which you want to create a new sub-folder to contain this study) by clicking the "new folder" icon. Each studyname in Lighthouse Studio has a maximum number of twenty-four characters (either letters or numbers) and Lighthouse Studio requires that the study be located within its own folder. The folder that Lighthouse Studio automatically creates for your study also carries the same name as the study. For this tutorial, you might create a name such as golfexample. From the New Lighthouse Study dialog, specify golfexample as the studyname.
Click the OK button. You are returned to the main menu and a new "Study Navigator" window is displayed along the left-hand side of the screen.
As you work with this study, items appear in the Study Navigator window, listing the functional areas you have been using or that are now available to you. This list of items provides a Shortcut link to access those parts of Lighthouse Studio. Alternatively, you can access those same areas by clicking icon buttons on the toolbar or by using the pull-down menus.
Now that we have created a Lighthouse study called golfexample, we can add our CBC exercise to that study. If the Write Questionnaire dialog isn't already displayed, click Compose | Write Questionnaire... to access the Write Questionnaire dialog. Place your cursor at the place in the questionnaire when you'd like to add the CBC exercise. Right now, there are no questions in your survey, so you can just click the last page break in the questionnaire list, and click the Add... button. Specify to add a new CBC exercise to the study (you can have multiple CBC exercises within the same study).
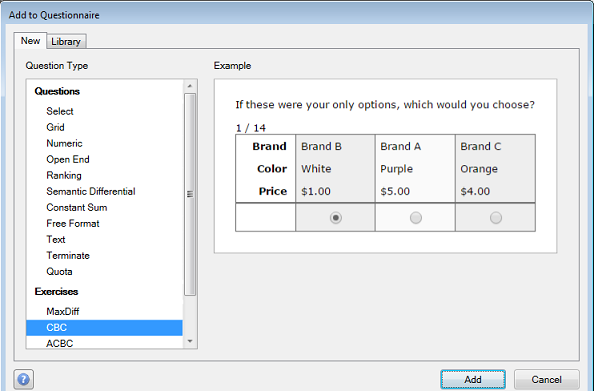
Click the Add button. You are prompted to enter an exercise name. Call it CBCgolfexercise.
Click OK and the CBC Exercise Settings dialog is shown. Click the Question Text tab and you see the following:
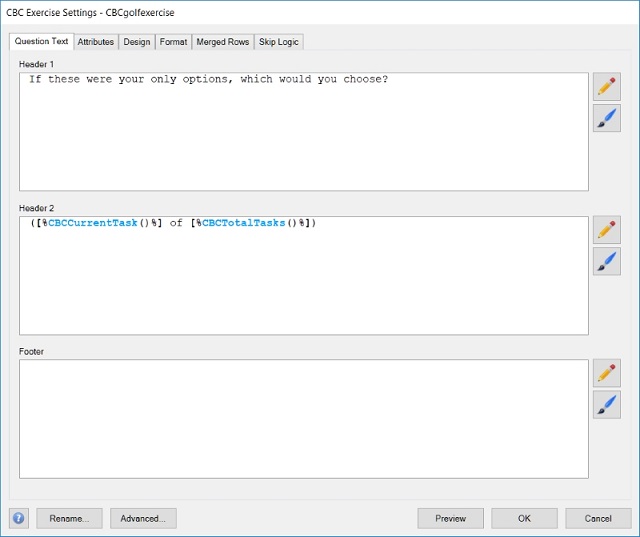
Default text is supplied within the Header 1 field. Paste the text we'll be using for this task into the Header 1 field:
If you were considering buying golf balls for your next outing and these were the only alternatives, which would you choose?
Header 2 contains special "Sawtooth Script" (a command language that works within Lighthouse Studio) for showing respondents which task number they are on, such as "(3 of 12)" etc. You do not need to modify this script for it to work automatically.
Entering the List of Attributes and Levels
To enter the list of attributes and levels you developed, go to the Attributes tab on the CBC Exercise Settings dialog.
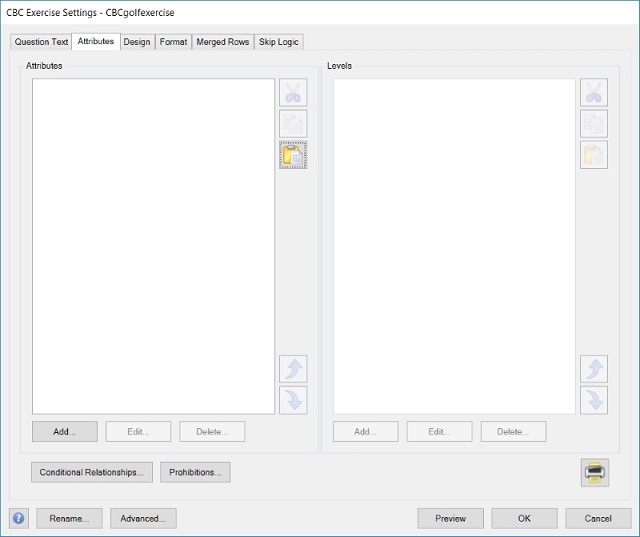
To add the first attribute, click the Add button (at the bottom left of the Attributes panel).
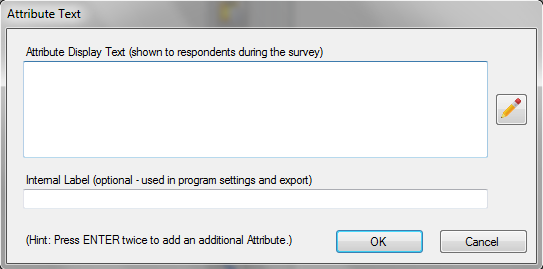
Type in the first attribute name: Brand:. The attribute name is a label that the respondent may see in the interview. If you want to use a shorter label to display to you as the questionnaire author for program settings and data export, specify that label in the Internal Label field. If you do not specify an internal label, the label in the Attribute Display Text is used. Click OK to accept this information and close the dialog.
Now that at least one attribute name is in the list, the Add button under the Levels panel becomes active. Also note that the Brand attribute is highlighted in the Attributes panel. With the Brand attribute highlighted in the Attributes panel, click the Add button under the Levels panel to add levels within the Brand attribute. The Level Text dialog is displayed. Type High-Flyer Pro, by Smith and Forester in the Level Display Text field. To add the next level of Brand, press the ENTER key twice. Type in the next level: Magnum Force, by Durango. Repeat the process for the remaining two levels of brand (see list repeated below).
When you are ready to add the next attribute (Performance:), click the Add button under the left Attributes panel, type the attribute label, and click OK to place that new attribute on the attribute list. With that new attribute highlighted on the attributes list, click the Add button under the Levels panel to add the three levels of that attribute.
Follow the same pattern for the last attribute, Price:. For your convenience, we repeat the full list of attributes below. Note that you can copy-and-paste attribute level text from this document (and other text documents) into the text fields within Lighthouse Studio. After highlighting the words to copy with your mouse, use the shortcuts Ctrl-C to copy and Ctrl-V to paste into the desired field. (Hint: you can select a list of attributes or levels from Word and paste into Lighthouse Studio using the Paste list member(s) from the clipboard ![]() icon. This can save a great deal of time.)
icon. This can save a great deal of time.)
Brand:
High-Flyer Pro, by Smith and Forester
Magnum Force, by Durango
Eclipse+, by Golfers, Inc.
Long Shot, by Performance Plus
Performance:
Drives 5 yards farther than the average ball
Drives 10 yards farther than the average ball
Drives 15 yards farther than the average ball
Price:
$4.99 for package of 3 balls
$6.99 for package of 3 balls
$8.99 for package of 3 balls
$10.99 for package of 3 balls
Now that you have finished entering the list of attributes and levels, we'll use the other tabs to continue developing our CBC exercise.
Additional Study Parameters
After you have specified your list of attributes and levels, you can specify other study parameters to govern your CBC exercise. From the CBC Exercise Settings dialog, click the Design tab:
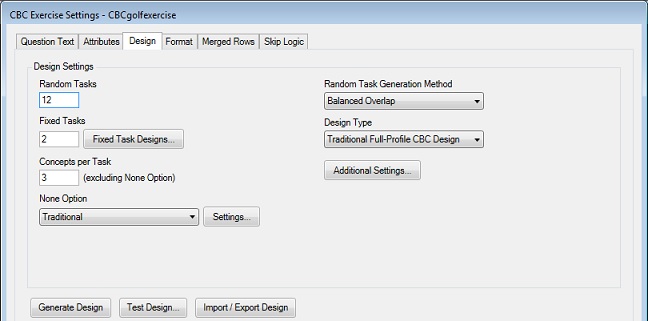
Here, you can specify how many Random (experimentally designed) choice tasks and how many fixed (user specified) tasks you want. For this golf ball study, we want 12 random and 2 fixed tasks.
As planned, the questionnaire shows three products on the screen, plus a None. Change the Number of Concepts per Task to be 3 (excluding the None option).
Recall that we want to include a "None" option in this CBC questionnaire. This gives respondents the option to indicate that they would choose none of the products displayed on the screen.
For the None Option Traditional is selected by default. You can specify the text to use for your None option by clicking the Settings... button. Click Settings... and specify the following text within the None Option dialog:
None: I Wouldn't Purchase Any of These
You can choose to display the None concept below the other concepts or alongside them. With only three golf ball concepts shown per task, we probably have enough room to display the None concept as the Last Concept in Task. Use the None Position drop-down to select Last Concept in Task. Click OK to close this dialog.
There are some additional settings that we should review. Recent research has suggested that the Balanced Overlap design approach (for selecting the combinations of features to show respondents) is a robust approach for studies like this, so select Balanced Overlap as the Random Task Generation Method. The Balanced Overlap approach selects combinations of attribute levels such that each level is shown nearly an equal number of times; and so that each level is shown with other levels nearly an equal number of times. Balanced Overlap also permits a modest amount of level repeating within each choice task (each screen); sometimes the same level will appear in competing product concepts.
By clicking the Additional Settings button you'll see a new dialog for specifying additional settings regarding the experimental design. It is useful to have many versions of the questionnaire (each showing a different combination of golf balls). This leads to efficient designs for estimating part-worth utilities and also controls for order bias. The default in the software is to generate 300 unique versions of the "Randomized" CBC tasks. Such a quantity may be overkill, but the software can handle this quite easily, so it seems prudent to go with a large number such as 300. Click OK to close the CBC Additional Design Settings dialog.
Next go to the Format tab.
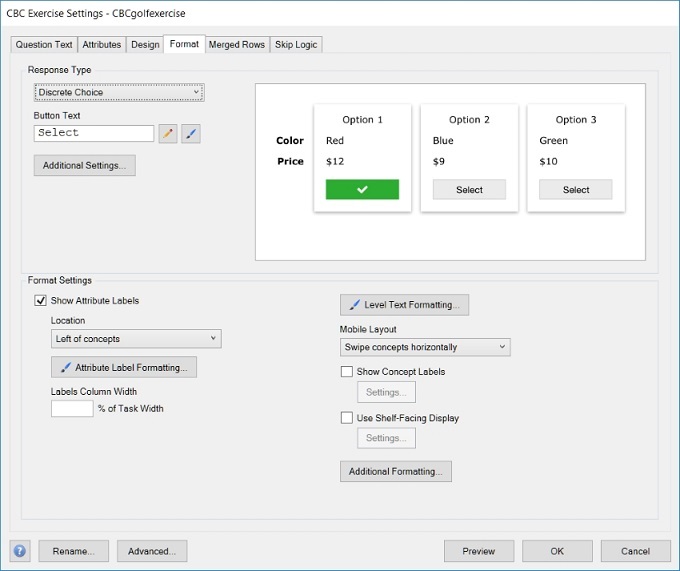
On this tab there are many options that you can use to change how your CBC task will be displayed. The Response Type setting allows you to choose between Discrete Choice, Best-Worst Choice, and Constant Sum. For now we will use Discrete Choice. There are many other settings on this tab that control whether or not to show column labels or how the task should show on mobile devices. For now the default settings should do.
To preview how the CBC task will look when it runs on the respondent's computer, click the Preview button. The question is displayed in "Preview" mode (no data are saved and no special "error checking" or "validation" is performed for the question).
This may or may not be the look you want for the questionnaire. You can modify the font and sizes of the font using the Paintbrush ![]() icon. Or, you can select a different Style (selecting styles was described in the 45-minute tutorial for Lighthouse Studio).
icon. Or, you can select a different Style (selecting styles was described in the 45-minute tutorial for Lighthouse Studio).
Go ahead and close the browser window by clicking the OK button. At this point, you might try modifying some of the settings on the Format tab. After each change you make, you can click Preview to see the effect of the changes.
Generating the Experimental Design
In CBC studies, we use a carefully chosen experimental design plan. The experiment involves observing how respondents react to different golf ball specifications. The design reflects the attribute combinations that make up the golf balls and how these combinations are placed into choice sets. Ideally, each respondent would receive a unique questionnaire version, with different combinations of golf balls arranged within sets in unique ways. There are only a finite number of possible combinations, so there potentially can be some identical choice tasks across respondents, but the idea is to improve measurement of the effects of the attribute levels (including reducing order and learning effects) by ensuring a high degree of variability in the choice tasks across individuals.
CBC lets you generate up to 999 unique versions of the questionnaire to be uploaded to the web server. By pre-specifying the design plans in a file residing on the server, we can simply assign each new respondent to the next design version within the file, which places minimal demands on the web server. Even if you have more than 999 respondents, once a reasonably large number of designs are allocated across respondents, the statistical gains of using even more questionnaire versions are very minimal. The default in the software is to use 300 design versions. Even 300 designs is probably overkill, but the software manages hundreds of designs for typical studies quite easily, and it seems beneficial to reduce order bias and improve design efficiency by using numerous questionnaire versions.
If you aren't already at the CBC Exercise Settings dialog, go there by navigating to the CBC exercise from the Study Navigator panel, or by clicking Compose | Write Questionnaire and editing a question within the exercise in the question list. Click the Design tab, and the following is displayed:
Many of the features of this dialog are beyond the scope of this tutorial. You can read additional details by pressing F1. We'll cover some of the basics here.
On the Random Task Generation setting, we specify which Random Task Generation Method to use This indicates the strategy that CBC uses to generate the "random" choice tasks in our study. We'd recommend using the Balanced Overlap method for this study.
Under the Additional Settings button you will find these settings:
Questionnaire Versions refers to how many unique versions of the CBC questions will be used in the survey. When respondents enter the questionnaire, they are assigned the next questionnaire version. Once a respondent is assigned the 300th version, the next respondent begins again with version #1, and so forth.
Attribute Randomization lets you randomize the order in which the attributes appear in the choice task. We specified the attribute list in the order Brand, Performance and Price. If we use the default (which is not to randomize the order), Brand will always appear in the top and Price always at the bottom. This seems like a natural presentation order for this study, so we'll retain the None for Attribute Randomization.
Concept Sorting controls how the concepts are arranged within the choice task. By default, the order of presentation is randomized. But, if we wanted the first brand always to appear in the first concept position, etc., we could specify to sort concepts based on Natural level order for Brand. You can investigate details regarding Concept Sorting by pressing F1. For this tutorial, we'll retain the defaults.
Once we are comfortable with our settings, we click OK to close the CBC Additional Design Settings dialog, then click Generate Design.
You are given two warnings, notifying you that you have yet to specify the composition of the two fixed tasks in your study. We'll do that later, so you can ignore the warnings (click Yes).
The following report is displayed:
CBC Design: Preliminary Counting Test
Copyright Sawtooth Software
2/8/2017 8:44:34 AM
Task generation method is 'Balanced Overlap' using a seed of 1.
Based on 300 version(s).
Includes 3600 total choice tasks (12 per version).
Each choice task includes 3 concepts and 3 attributes.
Att Lev Freq Level
1 1 2699 High-Flyer Pro, by Smith and Forester
1 2 2700 Magnum Force, by Durango
1 3 2700 Eclipse+, by Golfers, Inc.
1 4 2701 Long Shot, by Performance Plus
2 1 3600 Drives 5 yards farther than the average ball
2 2 3600 Drives 10 yards farther than the average ball
2 3 3600 Drives 15 yards farther than the average ball
3 1 2699 $4.99 for package of 3 balls
3 2 2701 $6.99 for package of 3 balls
3 3 2700 $8.99 for package of 3 balls
3 4 2700 $10.99 for package of 3 balls
This report counts the number of times each level appears across all versions and tasks of your questionnaire. It also provides two-way counts (not shown here due to space constraints) so you can see how often each level of one attribute appears with each level of different attributes.
The counting report indicates that 300 versions of the CBC questionnaire were created. We know that each version of the questionnaire had 12 "random" choice tasks, so a total of 300 x 12 = 3600 choice tasks were generated. The "Freq." column indicates how many times each level is represented in the design. Within each attribute, you can see that CBC has nearly perfectly balanced the presentation of levels.
If you include prohibitions in your design, sometimes designs can be inefficient. If the difference in the frequencies within attributes become fairly large, the software gives you a warning that your estimates may lack precision and you should reconsider your setup. If your design is significantly compromised, you will receive a warning stating that the design is deficient. You should re-evaluate and reformulate your design should this occur. Failure to correct the problem can result in unusable data.
You may wonder if small or modest differences from perfect balance in one- and two-way counts are problematic. The counting report is only a starting point and we strongly recommend you run the Test Design report to test the efficiency of your design (described further below).
Testing the Experimental Design
When you generated your CBC design, a preliminary counting report was shown so you could examine the one- and two-way frequencies across attribute levels. We strongly recommend you also run the Test Design capability which provides a more accurate test to ensure that given your planned sample size your CBC questionnaire will be able to estimate the attribute effects (utility scores) that you plan to investigate with adequate precision.
From the Design tab, click Test Design....
You are asked how many respondents you plan to collect and to approximate the expected None percentage (if you don't know, 15% is a typical None rate).
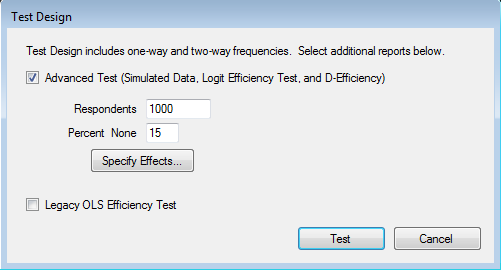
You plan to collect 250 respondents, so specify 250 in the Respondents field. You also have the ability to Specify Effects... to test the design with respect to more complex utility effects (such as interaction effects), but we won't get into that for this introductory tutorial.
Click Test and 250 random-responding (robotic) respondents are generated.
The Preliminary Counting Test is repeated to remind you the frequencies of each level across all 300 versions of your design. You can scroll through that to see the Advanced Test results based on the robotic 250 respondents. Only the first 250 versions of the design were seen by these 250 respondents, but since each version of the design has excellent design properties and can stand on its own, this is not concerning.
Some initial information about the choices the robotic (random-responding) respondents made is shown:
Logit Efficiency Test using Simulated Data
-------------------------------------------------------------
Main Effects: 1 2 3
Build includes 250 respondents.
Total number of choices in each response category:
Category Number Percent
-----------------------------------------------------
1 833 27.77%
2 898 29.93%
3 796 26.53%
4 473 15.77%
The four "categories" in the questionnaire are the four concept positions on the screen. The 4th category is the None choice, and the random-responding respondents used the None concept about the expected 15% of the time.
Following this preliminary information, information about the convergence of the aggregate logit model is reported (even though you will likely use HB for your final model, the aggregate logit model is a good way to assess the overall quality of your design). The details regarding the log-likelihood fit are not important for the robotic respondents (they are answering randomly). The only thing that matters is that this portion of the report tells you that the process converged.
There are 3000 expanded tasks in total, or an average of 12.0 tasks per respondent.
Iter 1 Log-likelihood = -4089.62582 Chi Sq = 138.51453 RLH = 0.25584
Iter 2 Log-likelihood = -4083.07299 Chi Sq = 151.62019 RLH = 0.25640
Iter 3 Log-likelihood = -4082.68402 Chi Sq = 152.39812 RLH = 0.25643
Iter 4 Log-likelihood = -4082.66661 Chi Sq = 152.43295 RLH = 0.25643
Iter 5 Log-likelihood = -4082.66590 Chi Sq = 152.43437 RLH = 0.25643
Iter 6 Log-likelihood = -4082.66587 Chi Sq = 152.43443 RLH = 0.25643
Iter 7 Log-likelihood = -4082.66587 Chi Sq = 152.43443 RLH = 0.25643
*Converged
Following this is a report of the standard errors for each utility effect in your logit model. Smaller standard errors are better. Based on our experience with many CBC data sets in practice, we recommend that you strive for standard errors for levels of each attribute that are 0.05 or less (the precision of the main effects). If you went beyond the default model and specified interaction effects, we recommend you strive for standard errors of 0.10 or less for any interaction terms.
(In the reporting below, you can ignore the standard error of the None parameter, as it is just a constant in the model and scales with the number of times it was chosen.)
Std Err Attribute Level
1 0.03831 1 1 High-Flyer Pro, by Smith and Forester
2 0.03824 1 2 Magnum Force, by Durango
3 0.03817 1 3 Eclipse+, by Golfers, Inc.
4 0.03804 1 4 Long Shot, by Performance Plus
5 0.03043 2 1 Drives 5 yards farther than the average ball
6 0.03060 2 2 Drives 10 yards farther than the average ball
7 0.03040 2 3 Drives 15 yards farther than the average ball
8 0.03831 3 1 $4.99 for package of 3 balls
9 0.03822 3 2 $6.99 for package of 3 balls
10 0.03785 3 3 $8.99 for package of 3 balls
11 0.03808 3 4 $10.99 for package of 3 balls
12 0.05010 NONE
The strength of design for this model is 908.20942
(The ratio of strengths of design for two designs reflects the D-Efficiency of one design relative to the other.)
Examining the standard errors for each of the levels (except the None, which we ignore), we can see that the precision of all the levels is better (lower) than the recommended target (<0.05). If you find that your standard errors are considerably larger than 0.05 for your studies in practice, you may want to take some steps to try to increase the precision. Those steps could include: a) increase the sample size, b) increase the number of tasks per respondent, c) increase the number of concepts per task, d) remove some prohibitions, e) decrease the number of levels in an attribute.
Finally, beneath the report of standard errors, the relative D-efficiency is shown (the relative strength of design).
The strength of design for this model is 908.20942
(The ratio of strengths of design for two designs reflects the D-Efficiency of one design relative to the other.)
The absolute size of this value is meaningless. How you should use this number is for comparing the relative merits of one design to another. For example, perhaps you modify a design to remove some prohibitions and you want to see by how much the overall design efficiency improved. Let's say that with prohibitions, the relative strength of design is 1378.5 and that by removing prohibitions the strength of design is 1511.3. The relative design efficiency with prohibitions to the design without prohibitions is equal to the ratio of the relative D-efficiencies, or 1378.5 / 1511.3 = 0.912. In other words, the design with prohibitions is 91.2% as efficient as the design without prohibitions.
Write Questionnaire Display
Click Close to close the test design report, and click OK to close the CBC Exercise Settings dialog.
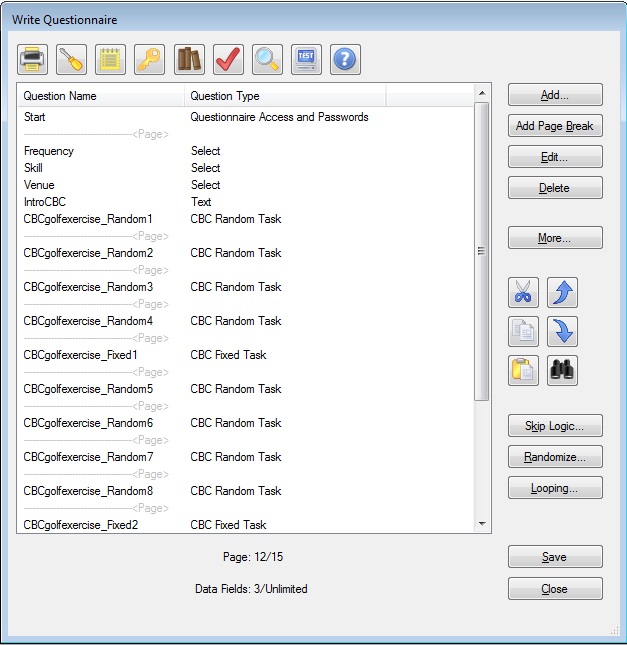
Let's now examine the questionnaire we've built to this point:
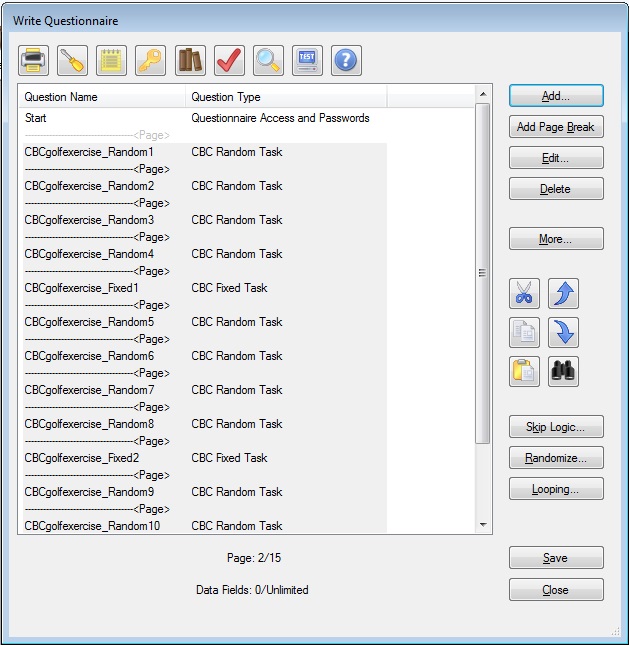
You'll note that Lighthouse has added 12 Random (CBCgolfexercise_Random1 through CBCgolfexercise_Random12) and 2 Fixed CBC tasks (CBCgolfexercise_Fixed1, CBCgolfexercise_Fixed2) to the survey. These questions are based on your settings and the default template. The Fixed tasks aren't yet in the proper positions (we wanted them in the 7th and 9th task positions in the survey). You also haven't yet specified the attribute combinations used for your user-defined Fixed tasks, so Lighthouse has inserted the questions with default levels that we'll modify shortly.
Before we fine tune those CBC questions, let's turn our attention to formatting other aspects of the survey.
Passwords and the Start Screen
Placing a survey on the web makes it convenient for a geographically dispersed population to take surveys. However, the danger is that the survey may become available to people that have not been invited to take the survey. Also, some respondents might try to take the survey multiple times. Assigning respondent passwords is a way to deal with both of these issues. Password assignment is beyond the scope of this tutorial, so to make things simple we'll assume that no passwords are to be used.
The Start screen is placed as the first page in your questionnaire, whether you are using passwords or not. If you are using passwords, it is the page in which respondents type passwords to access the survey. If not using passwords, you'll use this screen to specify any introductory/welcome text.
Let's enter the introductory text into the Start screen using the Write Questionnaire dialog. You can access the Write Questionnaire dialog by selecting Compose | Write Questionnaire… or by clicking the "pencil" icon ![]() on the toolbar.
on the toolbar.
The introductory text and other survey questions would most likely be initially developed within a word processing document. Assuming you really had such a document, you might use the Ctrl-C to copy and the Ctrl-V shortcuts to paste the information into Lighthouse Studio. We suggest you simply copy-and-paste the text within this document into your Lighthouse questions rather than re-type the text (if viewing this document with Acrobat Reader, you can use the "text select" icon ![]() from the Acrobat Reader toolbar.)
from the Acrobat Reader toolbar.)
The introductory screen is as follows:
Start:
Thank you for your willingness to participate in this study.
You are part of a special group of golfers we've selected to ask for feedback regarding golf equipment. By completing this survey, you'll be eligible for a drawing to receive a free set of PrimoDriver clubs.
(Click the Next button to continue)
|
We'll insert this introductory screen in the Start question that is automatically the first question of any Lighthouse survey. From the Write Questionnaire dialog open the Start question by highlighting it in the list of questions and clicking Edit.... Alternatively, you can double-click the Start question, and it automatically opens. The Questionnaire Access and Passwords dialog is displayed:
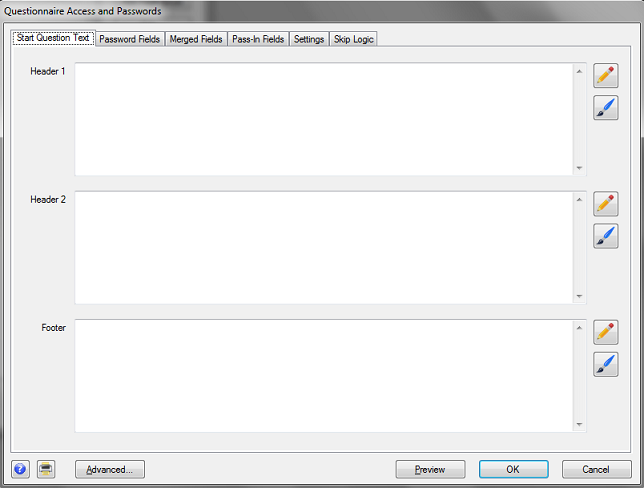
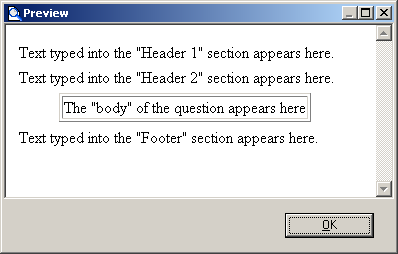
Most question types in Lighthouse Studio have "Header 1", "Header 2," "Body" and "Footer" sections. (The Start question has all but the "Body" section.) These are "text" areas in which you can insert any text (including HTML). When the question is viewed with a web browser, the sections are organized roughly as follows:
For this introductory screen (that includes three paragraphs of information), it seems to make sense to place the first paragraph in the "Header 1" area, the second paragraph in the "Header 2" area, and the third paragraph in the "Footer" area.
Type (or cut and paste) the following text for the Start question into the text areas in the Start question. Put the first paragraph in Header 1, the second paragraph in Header 2, and the third paragraph in Footer.
Thank you for your willingness to participate in this study.
You are part of a special group of golfers we've selected to ask for feedback regarding golf equipment. By completing this survey, you'll be eligible for a drawing to receive a free set of PrimoDriver clubs.
(Click the Next button to continue)
To preview how the question will look when it runs on the respondent's computer using Windows Explorer, click the Preview button. The question is displayed in "Preview" mode (no data are saved and no special "error checking" or "validation" is performed for the question).
Lighthouse Studio automatically places paragraph breaks (extra blank lines) between the Header 1, Header 2, and Footer sections. If you put all the text in a single section, you may see that when the web browser interprets the text, it all runs together without any blank lines between the paragraphs (unless you insert some HTML instructions to force blank lines between paragraphs). We'll talk about using HTML within your text to take greater control over the layout, font, and style later in this tutorial.
Click the OK button in the Preview window to close that window and return to the previous Lighthouse dialog.
After viewing the text in preview mode, you might decide that it is really too small, or that you want to make the text bold. You can change the size and styles (bold, italic, underline) or the text justification for the three major text sections by clicking the Paintbrush icon ![]() on the Start Question Text tab. After changing any setting, click Preview again.
on the Start Question Text tab. After changing any setting, click Preview again.
After you are happy with the layout of the Start screen, click OK to return to the Write Questionnaire dialog. If you need to move a question once it has been added to the List of Questions, simply highlight the question to be moved and click the ![]() or
or ![]() buttons to move the questions within the list (you can also highlight a question and click Ctrl-X or Ctrl-C to cut or copy and Ctrl-V to paste questions within the current questionnaire, or even to another Lighthouse study.)
buttons to move the questions within the list (you can also highlight a question and click Ctrl-X or Ctrl-C to cut or copy and Ctrl-V to paste questions within the current questionnaire, or even to another Lighthouse study.)
Now you are ready to specify the first Select-Type question:
Frequency:
First, we'd like to ask you about how often you golf. Would you say that you golf...
m 5 times or fewer per year m from 6 to 25 times per year m from 26 to 50 times per year m more than 50 times per year
|
First, make sure that you highlight the page break directly beneath the Start question on the List of Questions (when you add a new question, it is placed directly below the highlighted question/page break on the list). At the Write Questionnaire dialog, click Add..., choose Select as the question type, and type Frequency for the question name. Click OK and the Select Question dialog is shown.
Place the heading text for the question in the Header 1 field. To specify the response options, click the Response Options tab. From the Response Options tab, use the Add... button to add the four response options for this question. When you are finished, the question should look something like:
Now that you have seen how to specify Select question types in Lighthouse Studio, you have the tools you need to specify the remaining four select-type questions for the golf ball questionnaire (Skill, Venue, Gender and Income—please refer to the questionnaire text for these questions as presented near the front of this tutorial).
Remember that when you add a new question to the List of Questions, it is inserted directly below the question that was highlighted when you clicked the Add... button.
Formatting Text in Lighthouse Studio Questions
In addition to the Select questions we added to the questionnaire previously, there are two text-only instructional screens to add. Referring to the questionnaire we outlined earlier, these "questions" are named IntroCBC and Signoff. Even though the respondents aren't asked to provide specific inputs to these, we refer to these as "questions" in the sense that we add them to the questionnaire as if they were standard questions and they are listed separately by their "question" name in the List of Questions.
After the Venue question follows the text-only instructions:
IntroCBC:
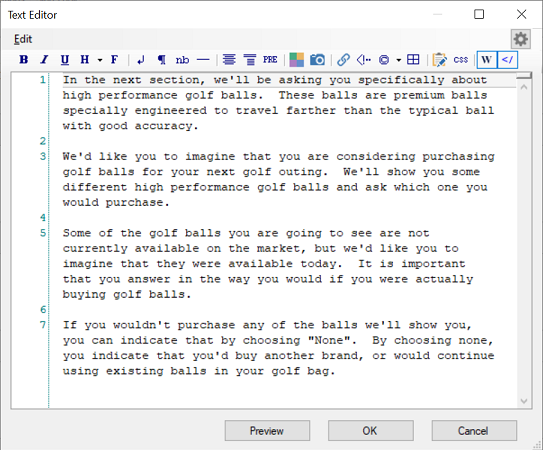
In the next section, we'll be asking you specifically about high performance golf balls. These balls are premium balls specially engineered to travel farther than the typical ball with good accuracy.
We'd like you to imagine that you are considering purchasing golf balls for your next golf outing. We'll show you some different high performance golf balls and ask which one you would purchase.
Some of the golf balls you are going to see are not currently available on the market, but we'd like you to imagine that they were available today. It is important that you answer in the way you would if you were actually buying golf balls.
If you wouldn't purchase any of the balls we'll show you, you can indicate that by choosing "None". By choosing none, you indicate that you'd buy another brand, or would continue using existing balls in your golf bag.
|
This text layout is a bit more challenging than we dealt with before (when we put three paragraphs of introductory text into the Start question). There are more than three separate paragraphs here and we'll need to deal with the additional element of bolding selected text.
Add a Text question directly following the Venue question in the questionnaire. To do so, highlight the Venue question, click Add… and specify the Question Name as IntroCBC and the question type as Text.
The Text dialog is displayed.
Earlier in this tutorial, when we used the Start question to format the opening page of the survey, we placed each paragraph of text in a separate Header 1, Header 2, or Footer section. We saw that Lighthouse Studio automatically places blank lines between text in these sections. However, with the text in the IntroCBC question, there are many more paragraph breaks. We'll take the opportunity here to introduce the concept of using a few simple HTML instructions within our survey text.
HTML stands for "HyperText Markup Language" and provides simple ways for you to enhance the look of your surveys, such as by bolding or underlining words, or making paragraph breaks within text. Browsers know how to interpret HTML instructions when displaying the page on the screen. If you know HTML, you can use it whenever you wish within Lighthouse surveys to accomplish your aims. If you don't know HTML, it isn't very difficult to learn a few HTML tricks, or you can use the toolbar available within the editor that appears when you click "Pencil" icons ![]() in Lighthouse Studio:
in Lighthouse Studio:
Either type or cut-and-paste the text for the IntroCBC question into the Header 1 text field (Any of the other three fields could be used also, though the Body field is indented). Click the "Pencil" icon to display the larger text editing window. Initially, the text appears something like this:
Even though it appears that there are extra blank lines between the paragraphs, web browsers ignore these hard returns (as well as more than one consecutive space characters), so you'll need to provide HTML instructions to insert these paragraph breaks (hard return plus blank line). HTML instructions are placed within <> brackets, called "tags." For example, the HTML instruction to create a paragraph break begins with an "open" paragraph tag written as <p> and optionally ends with a "close" paragraph tag written as </p>. The text to be formatted as a separate paragraph is enclosed within these tags. You can either directly type HTML within your document, or you can highlight text to be modified and click the icons on the HTML toolbar in the editor. If you highlight the first paragraph with your mouse:
In the next section, we'll be asking you specifically about high performance golf balls. These balls are premium balls specially engineered to travel farther than the typical ball with good accuracy.
and then (with the text in the first paragraph highlighted) click the "Paragraph" icon ![]() on the toolbar, this inserts a <p> prior to the text and a </p> after the text:
on the toolbar, this inserts a <p> prior to the text and a </p> after the text:
<p> In the next section, we'll be asking you specifically about high performance golf balls. These balls are premium balls specially engineered to travel farther than the typical ball with good accuracy.</p>
When the browser interprets this text, it doesn't display the "tags" but instead separates the text enclosed within the tags as a separate paragraph. Repeat the same for each of the paragraphs in the IntroCBC question.
Next, we need to bold certain words in the text. The HTML tags for bolding text are <b></b> (with the text to be bolded placed between the open and close bold tags). You can either directly type these tags within the document, or highlight the text to be bolded with the mouse and click the "Bold" icon ![]() on the toolbar. After you finish separating the paragraphs with <p></p> tags and bolding the appropriate text with <b></b> tags, it should look something like:
on the toolbar. After you finish separating the paragraphs with <p></p> tags and bolding the appropriate text with <b></b> tags, it should look something like:
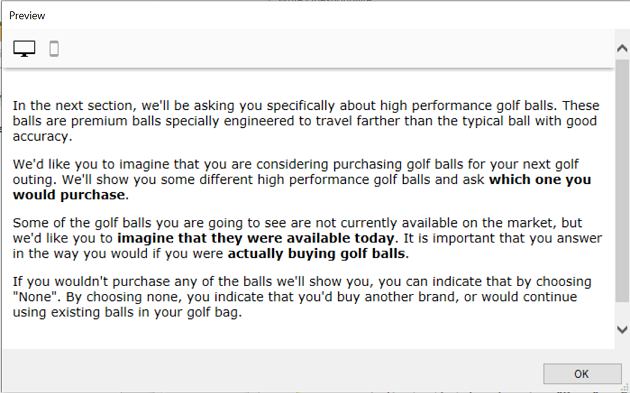
Click OK to return to the Text dialog and then Preview to see how the web browser displays this question. It should look like:
When you add the Signoff at the end of the survey, make sure to add it at the end of the survey as a Terminate question type. On the Settings tab of the Terminate question, click Terminate Respondent to indicate that respondents that reach this question are finished. Lighthouse Studio may warn you at this point that a terminating question must stand alone on its own "page" in the survey. This leads us into our next discussion on page layout.
Page Layout and Study Settings
It may be helpful at this point to review how Lighthouse breaks the survey into separate pages and some basic global settings that affect the look and functionality of your questionnaire. The Write Questionnaire dialog also displays the page breaks that may be currently set for your questionnaire.
This dialog shows how the various questions we've specified (or that Lighthouse Studio has automatically added to the list) are arranged across different pages. Page breaks are indicated by "---------------<Page>". Notice that the preliminary questions (Frequency, Skill and Venue and IntroCBC) we've added to the questionnaire are all currently arranged on the same page. Let's assume we wanted to break these up, one question per page. You add a page break after the Frequency question by highlighting Frequency on the list and clicking the Add Page Break button. Frequency is now placed on its own page. Repeat this operation to place Skill, Venue, IntroCBC and CBCgolfexercise_Random1 on separate pages. Make sure to place the final Terminate screen Signoff on its own (last) page.
While we had been adding page breaks for our questionnaire, you may have noted that the two fixed CBC tasks (CBCgolfexercise_Fixed1 and CBCgolfexercise_Fixed2) are not yet in the 7th and 9th CBC task positions. You can move a question on the list by highlighting the question in the List of Questions and clicking the ![]() or
or ![]() buttons to move the question to another point in the questionnaire. Move CBCgolfexercise_Fixed1 directly after CBCgolfexercise_Random6 and move CBCgolfexercise_Fixed2 directly after CBCgolfexercise_Random7. You may need to re-arrange the page breaks so that each CBC question remains on its own page.
buttons to move the question to another point in the questionnaire. Move CBCgolfexercise_Fixed1 directly after CBCgolfexercise_Random6 and move CBCgolfexercise_Fixed2 directly after CBCgolfexercise_Random7. You may need to re-arrange the page breaks so that each CBC question remains on its own page.
Specifying Fixed Tasks
A fixed choice task looks just like the other "Random" (experimentally designed) tasks. However, rather than let the design algorithm determine the combination of attribute levels to be shown for each respondent, you specify the codes for the levels to be displayed in each fixed product concept. Recall that the purpose of specifying fixed holdout tasks for this example is to achieve a controlled and direct measure of the existing competitors' offerings versus our client's proposed offerings. You'll also be able to use the results to check the ability of the market simulator you develop using the 12 random choice tasks to predict the responses to the 2 fixed holdout tasks.
Recall that our list of questions already includes two fixed tasks named CBCgolfexercise_Fixed1 and CBCgolfexercise_Fixed2. These tasks will look exactly like the experimentally designed (random) tasks within the survey, except that you'll specify which levels to show in those two tasks. Edit any of your CBC questions (or use the Study Navigator panel to directly go to the CBC exercise). Go to the Design tab on the the CBC Exercise Settings dialog.
To modify the levels displayed in the fixed choice task, click the Fixed Task Designs… button.
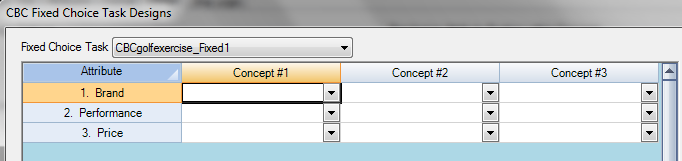
From this one dialog, you can specify the attribute combinations to be used in each of your fixed tasks. To change from one fixed task to another, use the Fixed Choice Task drop-down box at the upper-left hand corner of the dialog. We'll first modify CBCgolfexercise_Fixed1.
Recall that the first fixed holdout was to display the following three products:
High-Flyer Pro, by Smith and Forester
Drives 15 yards farther than the average ball
$10.99 for package of 3 balls |
Long Shot, by Performance Plus
Drives 10 yards farther than the average ball
$6.99 for package of 3 balls |
Magnum Force, by Durango
Drives 5 yards farther than the average ball
$8.99 for package of 3 balls |
None: I Wouldn't Purchase Any of These |
Use the drop-down controls provided to specify the three product concepts as shown.
Click the OK button when finished. Preview the fixed holdout task to make sure it looks as you expect. Make any necessary changes.
Next, you need to modify the second fixed holdout task. From the CBC Fixed Choice Task Settings, used the Fixed Choice Task drop-down control to select CBCgolfexercise_Fixed2. Modify it to have the appropriate specifications for our second fixed choice task:
Magnum Force, by Durango
Drives 5 yards farther than the average ball
$8.99 for package of 3 balls |
Eclipse+, by Golfers, Inc.
Drives 10 yards farther than the average ball
$6.99 for package of 3 balls |
High-Flyer Pro, by Smith and Forester
Drives 15 yards farther than the average ball
$10.99 for package of 3 balls |
None: I Wouldn't Purchase Any of These |
Again, preview this task to make sure it looks as expected (from the Write Questionnaire dialog, right-click the fixed task you wish to preview, then select Preview...).
Adding Polish and Style
You have probably noted that the survey we've created is pretty bland-looking. We can add some polish and style by clicking the Survey Settings icon ![]() from the Write Questionnaire dialog (or by clicking Compose | Survey Settings from the main menu).
from the Write Questionnaire dialog (or by clicking Compose | Survey Settings from the main menu).
First, let's select a style from the Styles tab. Select a style you wish to use and click Use Selected at the bottom of the dialog to implement the style. We'll select apollo as the style, but you might want to experiment with other styles.
On the Headers and Footers tab, you can specify a Header and a Footer. We'll specify Golf Ball Survey as the header text.
When you go back and test run the survey, your survey should have a bit more polish. Under Apollo style, our survey now looks like:
Test Running Your Survey Using "Local Test Server"
Although the Preview Survey function is nice, you generally will want to test your survey in runtime mode, with any skip patterns, response verification, and randomizations in place. You could upload your files to a remote server, but Lighthouse Studio provides a more convenient way to test run your survey locally on your device. We strongly recommend you test using both desktop and mobile views.
Local Test Server
From the Write Questionnaire dialog, Click the Test Survey button ![]() .
.
Your browser opens up the first survey page. This is your survey, as it would appear to a respondent over the Internet (there are slight visual differences from browser to browser).
To close the survey, simply close the browser window (using the X in the upper-right hand corner). To run the survey again, click the Test Survey button ![]() .
.
After you have edited the survey to the point that you are pleased with its look, content, and functionality, you should examine the test data you've collected using Local Test Server (this process is described in a separate tutorial called "Getting Started with Lighthouse Studio: A 45-minute Hands-On Tour" available on the Help menu), then at least examine the CBC data using Counting analysis (described later). The results should generally reflect your preferences (assuming you answered in a rational manner). If they don't, this suggests something may be wrong with your study setup.
After you are convinced that the survey is functioning properly, you should also pretest your survey among your colleagues. They can give you feedback regarding the usability of the survey, and you can examine the resulting Counts data or perhaps even the part-worths (assuming you have enough data) to make sure the data at least have face validity.
Pretesting and Fielding
Let's now return to the marketing problem and story we began at the beginning of this document.
After you have tested the survey (on both large and small screen devices) using Local Test Server, you post the survey to the Web on your web server, on a server provided by an ISP (Internet Service Provider), or through Sawtooth Software's web hosting service. (Setting up your survey on the web is beyond the scope of this unit, but is described in detail in the Lighthouse help documentation. Fielding options also include hosting on your own company's server, or using Sawtooth Software's hosting service).
The next day, you send an email to your client, with a link to take the survey. The president of Performance Plus first takes a survey and suggests some minor wording changes. After you make those changes, you invite six other individuals at Performance Plus take the survey. You download the results and analyze the resulting data. Due to the small sample size, the results are a bit noisy (and there is an obvious bias toward your client's balls), but the data seem to feel right.
Next, you recruit six golf enthusiasts within your city to come to a central site to take the survey. You watch silently as they take the survey. At the end of each session, you ask each respondent follow-up questions to ensure that there weren't any parts that were difficult to understand or just didn't make sense. You ask them specifically about the choice tasks, making sure that there wasn't too much information on the screen at once, and that they didn't feel overwhelmed with the task. After debriefing the test respondents and analyzing their data to ensure that the results looked reasonable, you make a few small adjustments to the questionnaire and attribute descriptions, and proceed to field.
Via the sample provider, you email the invitations and obtain 250 total completes.
The completed data reside on the server where you uploaded the Lighthouse survey. The details for viewing and downloading the data from the server are provided in other areas of the Lighthouse documentation and are beyond the scope of this CBC unit. Even so, it is useful to at least describe the steps you would perform to access and download the data from the Web, estimate the part-worth utilities, and begin analysis using the market simulator.
Data Management, Utility Estimation, and Market Simulations
Lighthouse Studio includes an Admin Module so that you can monitor or access your project from any device that is connected to the Web. The Admin Module is password protected and your passwords for access are specified on the Field | Hosting Management dialog. Lighthouse Studio generates random administrative access passwords whenever you create a new study, but you can modify them to suit your needs.
To download the data from the 250 respondents to the golf ball study, you would browse to the administrative module for your study on the web site (again, we are speaking hypothetically, as for this tutorial study there is no such site set up). Once at the Admin Module, you would download your data (by clicking Data Management | Download from the main Admin Module menu), making sure to save your data file to the same folder on your hard drive in which you developed the Lighthouse project. Alternatively, from the Lighthouse Studio interface, you can simply click Field | Data Management then Get Data to download your data automatically.
CBC researchers employ a variety of techniques for analyzing their data. One common approach for initially understanding the basic, summary preferences for the market is called "Counting" analysis. This produces proportions from 0.0 to 1.0 for each level in your study, reflecting how often this level was chosen, when available in a choice set. The higher the proportion, the higher preference for the level. While this method of analysis has good intuitive appeal, there are more powerful ways to analyze the data based on estimation of part-worth utilities and subsequent market simulations.
There are three part-worth estimation routines that Sawtooth Software provides. The first technique is called multinomial logit, which "pools" respondent data in a single aggregate model. This technique was the first part-worth estimation technique that Sawtooth Software used for analyzing CBC data in the early 1990s. It is a good technique for quickly summarizing the results for the sample, but it ignores respondent heterogeneity and is quite susceptible to the IIA (red-bus/blue-bus) problem, which is discussed in many technical papers and in the CBC help documentation. Latent class is an important technique since it can find and fit logit models within segments of respondents who have similar preferences. Latent class is often used in market segmentation and targeting. The third technique included in Lighthouse Studio's CBC is Hierarchical Bayes (HB), widely considered the gold standard, which models heterogeneity (differences in tastes) at the individual level. HB is the most popular method among Sawtooth Software users for developing the final model and market simulator to deliver to clients.
It is beyond the scope of this tutorial to go into much depth on these part-worth estimation methods. The three part-worth estimation programs (logit, latent class, and HB) all work seamlessly within the Lighthouse Studio interface. The final step of market simulations (what-if analysis) is also integrated within Lighthouse Studio. You may also take the part-worth utility results of the utility estimation programs and import them into another statistical analysis package of your choice. Sawtooth Software offers two such simulators: 1) a choice simulator integrated within Lighthouse Studio (and also available as a standalone program for you and/or your clients to use), or 2) a web-based market simulator with fewer advanced options called the Online Simulator.
Analyzing the CBC Data Using Counts
Hypothetical data for 250 respondents for this golf ball study are provided within the CBC tutorial study installed with Lighthouse Studio. To open that project, click Help | Sample Studies | Choice-Based Conjoint (CBC).
If you used a randomized design (which we did for this project), usually the first step in analyzing the choice results is to conduct a "Counting" analysis. CBC's Counts program reports the percent of times each attribute level was chosen when it was available on the screen. Counts provides an intuitive measure of the impact of each attribute level on overall choice for golf balls. Counts are proportions ranging from 0 to 1. For example, a Count of 0.31 for an attribute level would mean that when a golf ball was displayed including that particular level, respondents chose it 31% of the time.
To conduct analysis such as Counts (or logit, latent class, HB), select Analysis | Analysis Manager... and then from the Analysis Run Manager dialog click the Add button. You can perform multiple analysis runs. For each analysis run you perform, a tab opens up to report your settings and results. Your first analysis run is named Analysis run 1 by default (you may change this name).
To perform Counts analysis, change the Analysis Types drop-down control to Counts. Next, click the Run button to run counting analysis.
By default, the Counts program analyzes all one-way and two-way Count proportions. Notice also by default that the Counts program uses only responses to the 12 randomized choice tasks you fielded (under CBC Counts Settings, Tasks it indicates that 12 random tasks are included). The two fixed holdout tasks are not included. That is because results from Counts assume random designs where each attribute level appears an equal number of times with each level of the other attributes. Randomized designs (with no prohibited level combinations) make it possible to analyze the effect of each attribute level independent of all other levels. That characteristic does not usually hold if fixed holdout tasks are included in the analysis.
The following report is displayed in the report window:
Brand:
Total
Total Respondents 250
High-Flyer Pro, by Smith and Forester 0.381
Magnum Force, by Durango 0.425
Eclipse+, by Golfers, Inc. 0.213
Long Shot, by Performance Plus 0.193
Within Att. Chi-Square 305.184
D.F. 3
Significance p < .01
Performance
Total
Total Respondents 250
Drives 5 yards farther than the average ball 0.113
Drives 10 yards farther than the average ball 0.323
Drives 15 yards farther than the average ball 0.474
Within Att. Chi-Square 651.389
D.F. 2
Significance p < .01
Price:
Total
Total Respondents 250
$4.99 for package of 3 balls 0.528
$6.99 for package of 3 balls 0.297
$8.99 for package of 3 balls 0.214
$10.99 for package of 3 balls 0.173
Within Att. Chi-Square 560.899
D.F. 3
Significance p < .01
Brand: x Performance:
Total
Total Respondents 250
High-Flyer Pro... Drives 5 yards farther... 0.148
High-Flyer Pro... Drives 10 yards farthe... 0.415
High-Flyer Pro... Drives 15 yards farthe... 0.580
Magnum Force, ... Drives 5 yards farther... 0.183
Magnum Force, ... Drives 10 yards farthe... 0.455
Magnum Force, ... Drives 15 yards farthe... 0.636
Eclipse+, by G... Drives 5 yards farther... 0.067
Eclipse+, by G... Drives 10 yards farthe... 0.212
Eclipse+, by G... Drives 15 yards farthe... 0.361
Long Shot, by ... Drives 5 yards farther... 0.053
Long Shot, by ... Drives 10 yards farthe... 0.208
Long Shot, by ... Drives 15 yards farthe... 0.317
Interaction Chi-Square 12.638
D.F. 6
Significance p < .05
Brand: x Price:
Total
Total Respondents 250
High-Flyer Pro... $4.99 for package of 3... 0.622
High-Flyer Pro... $6.99 for package of 3... 0.384
High-Flyer Pro... $8.99 for package of 3... 0.266
High-Flyer Pro... $10.99 for package of ... 0.253
Magnum Force, ... $4.99 for package of 3... 0.648
Magnum Force, ... $6.99 for package of 3... 0.439
Magnum Force, ... $8.99 for package of 3... 0.356
Magnum Force, ... $10.99 for package of ... 0.256
Eclipse+, by G... $4.99 for package of 3... 0.425
Eclipse+, by G... $6.99 for package of 3... 0.190
Eclipse+, by G... $8.99 for package of 3... 0.144
Eclipse+, by G... $10.99 for package of ... 0.094
Long Shot, by ... $4.99 for package of 3... 0.417
Long Shot, by ... $6.99 for package of 3... 0.174
Long Shot, by ... $8.99 for package of 3... 0.091
Long Shot, by ... $10.99 for package of ... 0.089
Interaction Chi-Square 49.810
D.F. 9
Significance p < .01
Performance: x Price:
Total
Total Respondents 250
Drives 5 yards... $4.99 for package of 3... 0.254
Drives 5 yards... $6.99 for package of 3... 0.108
Drives 5 yards... $8.99 for package of 3... 0.053
Drives 5 yards... $10.99 for package of ... 0.035
Drives 10 yard... $4.99 for package of 3... 0.593
Drives 10 yard... $6.99 for package of 3... 0.297
Drives 10 yard... $8.99 for package of 3... 0.208
Drives 10 yard... $10.99 for package of ... 0.192
Drives 15 yard... $4.99 for package of 3... 0.737
Drives 15 yard... $6.99 for package of 3... 0.485
Drives 15 yard... $8.99 for package of 3... 0.381
Drives 15 yard... $10.99 for package of ... 0.292
Interaction Chi-Square 47.155
D.F. 6
Significance p < .01
None
Total
Total Respondents 250
None Chosen 0.091
At first, this report may seem overwhelming, so we'll break it up and discuss it in pieces. First, Counts reports that 250 respondents were used. Then, the count proportions for brand name are displayed:
High-Flyer Pro, by Smith and Forester 0.381
Magnum Force, by Durango 0.425
Eclipse+, by Golfers, Inc. 0.213
Long Shot, by Performance Plus 0.193
Magnum Force, by Durango was the most preferred ball name and brand on average, being chosen 42.5% of the times that is was presented and available for choice. Your client's ball name and brand, Long Shot, by Performance Plus, was the least preferred at 19.3%. If your client markets their ball under the Eclipse+ name with the Golfers, Inc. brand, choice probability improves from 19.3% to 21.3%. These are ratio quality data, so one might infer from the counts that using the Golfers, Inc. name and brand increases the probability of choice by 10% (21.3/19.3 - 1).
Next comes the counts for Performance:
Drives 5 yards farther than the average ball 0.113
Drives 10 yards farther than the average ball 0.323
Drives 15 yards farther than the average ball 0.474
Respondents on average chose balls that flew 15 yards farther more than four times as often as those that flew 5 yards farther. Flight distance appears to be a very important attribute. A preliminary conclusion might be that it's very important to be able to produce a ball that flies 10 or especially 15 yards farther than the average ball.
Last comes price:
$4.99 for package of 3 balls 0.528
$6.99 for package of 3 balls 0.297
$8.99 for package of 3 balls 0.214
$10.99 for package of 3 balls 0.173
As expected, respondents prefer lower prices over higher ones. Probability of choice decreases quite a bit from $4.99 to $6.99, then seems to decrease less rapidly from $6.99 to $8.99 and from $8.99 to $10.99.
To this point, you've only analyzed one-way (main effect) effects of attribute levels on choice. You can further consider the probabilities of choice when a combination of two attribute levels are available for choice. There are three tables of two-way probabilities in our study. Rather than look at all three, let's examine the table (brand x price) that appears (by the Chi-Square statistic) to show the most promise of being interesting (and reflect a potentially significant interaction effect) for our study:
High-Flyer Pro... $4.99 for package of 3... 0.622
High-Flyer Pro... $6.99 for package of 3... 0.384
High-Flyer Pro... $8.99 for package of 3... 0.266
High-Flyer Pro... $10.99 for package of ... 0.253
Magnum Force, ... $4.99 for package of 3... 0.648
Magnum Force, ... $6.99 for package of 3... 0.439
Magnum Force, ... $8.99 for package of 3... 0.356
Magnum Force, ... $10.99 for package of ... 0.256
Eclipse+, by G... $4.99 for package of 3... 0.425
Eclipse+, by G... $6.99 for package of 3... 0.190
Eclipse+, by G... $8.99 for package of 3... 0.144
Eclipse+, by G... $10.99 for package of ... 0.094
Long Shot, by ... $4.99 for package of 3... 0.417
Long Shot, by ... $6.99 for package of 3... 0.174
Long Shot, by ... $8.99 for package of 3... 0.091
Long Shot, by ... $10.99 for package of ... 0.089
This table shows the probability of choice for each brand when it was shown at each price. This table is more involved than the simpler one-way tables you examined. Therefore, it may be helpful to plot the results with a graphics or spreadsheet package.
If you plot price on the x-axis and probability of choice on the y-axis, it would appear like the familiar demand curves one learns about in economics. We should note, however, that counting analysis has some drawbacks and inaccuracies associated with it. There are more accurate ways to generate demand curves with CBC using the market simulator. Also, demand curves from CBC assume perfect information, equal distribution, and other assumptions mentioned in the online Help.
The "pseudo demand curves" seem to suggest that the Eclipse+ name is preferred over all levels of price to the Long Shot name. Also, the gap appears to widen slightly as prices increase—though we cannot tell from this chart whether that is a significant or a chance occurrence.
After you have spent some time looking at the choice results for the randomized tasks, you might consider also looking at the results for the fixed holdout tasks. Recall that we asked these fixed scenarios to gauge preference for what may play out as actual future market scenarios. We also asked these fixed questions so that we could see how well the market simulator predicts the preferences for those two questions.
Recall that the first holdout task was asked as the seventh task, and the second holdout as the ninth. To analyze responses for the first holdout, you need to perform counting analysis again, this time isolating only the seventh choice task. To do that, while in the Analysis Run Manager dialog, click the Settings icon (![]() ), then click the Tasks setting. Only check the CBCgolfexercise_Fixed1 task. Click OK to close the dialog. You will only be interested in one-way (Main Effect) counts, so in the Advanced area, un-check the 2-Way Interactions selection (leaving only Main Effects checked). Click OK and click the Run button again. The Counts for brand are displayed (after a warning to make sure you really intended to include a fixed task in the Counts report):
), then click the Tasks setting. Only check the CBCgolfexercise_Fixed1 task. Click OK to close the dialog. You will only be interested in one-way (Main Effect) counts, so in the Advanced area, un-check the 2-Way Interactions selection (leaving only Main Effects checked). Click OK and click the Run button again. The Counts for brand are displayed (after a warning to make sure you really intended to include a fixed task in the Counts report):
High-Flyer Pro, by Smith and Forester 0.556
Magnum Force, by Durango 0.076
Eclipse+, by Golfers, Inc. *
Long Shot, by Performance Plus 0.200
Recall that we did not display Eclipse+ in the first holdout task, so it is marked with an asterisk. Further below in the report, the None percent is reported as 16.8%. For review, here is the configuration for the first fixed holdout task, with the choice probabilities we just computed displayed:
55.6%
High-Flyer Pro, by Smith and Forester
Drives 15 yards farther than the average ball
$10.99 for package of 3 balls |
20.0%
Long Shot, by Performance Plus
Drives 10 yards farther than the average ball
$6.99 for package of 3 balls |
7.6%
Magnum Force, by Durango
Drives 5 yards farther than the average ball
$8.99 for package of 3 balls |
16.8%
None: I Wouldn't Purchase Any of These |
If you isolate only the second fixed holdout task (by selecting only CBCgolfexercise_Fixed_T2 in the Choice Tasks to Include dialog) and click Run, you'll get the following probabilities for the second holdout task:
8.0%
Magnum Force, by Durango
Drives 5 yards farther than the average ball
$8.99 for package of 3 balls |
26.4%
Eclipse+, by Golfers, Inc.
Drives 10 yards farther than the average ball
$6.99 for package of 3 balls |
54.4%
High-Flyer Pro, by Smith and Forester
Drives 15 yards farther than the average ball
$10.99 for package of 3 balls |
11.2%
None: I Wouldn't Purchase Any of These |
Each of these choice probabilities are based only on 1 task x 250 respondents = 250 total choice tasks, whereas the previous counting data was based on a total of 12 tasks x 250 respondents = 3,000 total tasks.
In accordance with the previous conclusion we made based on the random choice tasks, the holdout data suggest that there is some benefit from using the Eclipse+, by Golfers, Inc. name.
As a final note on counting analysis, one should not put too much emphasis in the None percentage. We shouldn't conclude that since the None percentage is running at about 10% that 90% of these respondents would be expected to purchase a premium ball for their next golf outing. It is our experience that respondents tend to exaggerate their likelihood to purchase or to choose products in survey research. There is a tendency toward "helping" (acquiescence) behavior. The actual proportion of buyers that purchase premium balls would probably be significantly less. (The Dual-Response None option available within CBC can help reduce the overstatement of purchase intent.)
Now that you have spent some time learning about the Choice results using the Counts program, you are ready to run logit analysis for a top-line quick analysis and then HB for your final model to use within the market simulator. (Latent Class is available as well for finding market segments that have similar preferences, but we will skip that discussion here.)
Analyzing the Choice Data Using Logit
Aggregate logit is an older and less advanced technique for analyzing choice results. But, it is a quick way to analyze results, and a recommended starting point for learning about the essential characteristics of your data.
Logit analysis estimates an effect, or logit "utility" for each level of each attribute. It also can be used to estimate interaction effects. A utility refers to a degree of worth or preference for a product feature. As with any complex analytical tool, we suggest you learn as much about the technique as you can, to ensure that you interpret the results wisely. Much more information about logit analysis and logit utilities can be found in the online help.
To run logit, select Analysis | Analysis Manager... and click the Add button to add a new analysis run. First change the Analysis Types drop-down box to Logit. You may review the settings for the run by clicking the Settings icon (![]() ). You should provide the following settings (it should be there by default):
). You should provide the following settings (it should be there by default):
Respondent Filter |
(Include All Respondents) |
Weights |
(Equal) |
Tasks |
(12 Random) |
After you have checked these settings and have clicked OK to close the CBC Logit Settings dialog, click Run. The following report is displayed (some details in the report are omitted below for clarity):
Number of Respondents |
250 |
|
|
|
|
|
|
Log-likelihood for this model |
-2813.89 |
|
|
Log-likelihood for null model |
-4158.88 |
|
|
Difference |
1344.99 |
|
|
|
|
|
|
Variable |
Effect |
Std Error |
t Ratio |
High-Flyer Pro, by Smith and Forester |
0.49198 |
0.04381 |
11.22930 |
Magnum Force, by Durango |
0.72225 |
0.04414 |
16.36376 |
Eclipse+, by Golfers, Inc. |
-0.55176 |
0.04911 |
-11.23483 |
Long Shot, by Performance Plus |
-0.66248 |
0.04998 |
-13.25496 |
|
|
|
|
Drives 5 yards farther than the average ball |
-1.22253 |
0.04794 |
-25.50154 |
Drives 10 yards farther than the average ball |
0.28303 |
0.03649 |
7.75732 |
Drives 15 yards farther than the average ball |
0.93951 |
0.03729 |
25.19739 |
|
|
|
|
$4.99 for package of 3 balls |
1.22096 |
0.04601 |
26.53917 |
$6.99 for package of 3 balls |
0.03145 |
0.04413 |
0.71260 |
$8.99 for package of 3 balls |
-0.45471 |
0.04766 |
-9.53992 |
$10.99 for package of 3 balls |
-0.79770 |
0.05135 |
-15.53399 |
|
|
|
|
NONE |
-0.85265 |
0.06653 |
-12.81535 |
The column labeled "Effect" contains the utilities for each level of each attribute. The higher (more positive) the utility, the more preferred the level. The utilities sum to 0 within each attribute (they are zero-centered).
The next column displays the standard errors for each logit effect. Earlier under Counting analysis, we saw that Eclipse+ was preferred to Long Shot, but we could not tell at that point if the result was statistically significant. Here, we note that the utility for Eclipse+ is 0.11072 utility points higher than Long Shot (-0.55176 - -0.66248). We also note the standard errors for each of these utilities. The pooled standard error for the difference between these two utilities is equal to the square root of the sum of the squared standard errors, or SQRT(0.049112 + 0.049982) = 0.07007. To get the t-value, we divide the difference in the two utilities by the pooled standard error 0.11072 / 0.07007 = 1.58. If we look this up on a standard t-table, we see that this difference is significant at just shy of the 90% confidence interval. Therefore, we are almost 90% confident that the Golfers, Inc. name is more preferred to the Performance Plus name.
The logit run above reflects main effects only (no interactions). The results from Counts suggested that interaction effects might be significant. We will not go into detail in this tutorial regarding how to test for significance of interaction terms in logit or HB. But, experience with many CBC datasets in practice finds that interactions that appear significant in aggregate logit utility runs usually are not significant once you estimate utilities at the individual level via HB. For simplicity in this introductory tutorial, we will focus on just main effects.
If you are interested in how to specify interaction effects, the process is the same whether using logit, latent class, or HB within the Lighthouse interface. For example, to include the interaction between brand and price in your logit run, click Analysis | Analysis Manager... Click Add to create a new run (named by default Analysis run 3) and change the Analysis Types to Logit. Click the Settings icon (![]() ) and click Attribute Codings.
) and click Attribute Codings.
At the bottom of the Attribute Codings dialog, click the Add... button to add interactions. Two columns are displayed, with the attributes in both column. To specify the interaction between brand and price, click brand on the left side of the dialog and price on the right side. Click OK. You are returned to the CBC Logit Analysis Settings dialog. Click OK again to close the dialog. Then, click Run. The Analysis run 3 solution is computed including main effects and interactions.
HB Estimation of Utilities
We strongly recommend using HB estimation for the final model you use within your market simulator. That said, aggregate logit is useful for a top-line view of your data and Latent Class is very helpful for developing segmentation strategies and perhaps using the segment membership variable as a banner point within the market simulator.
To compute HB utilities, select Analysis | Analysis Manager... and click the Add button to add a new analysis run. First change the Analysis Types drop-down box to HB. You may review the settings for the run by clicking the Settings icon (![]() ). You should provide the following settings (it should be there by default):
). You should provide the following settings (it should be there by default):
Respondent Filter |
(Include All Respondents) |
Tasks |
(12 Random) |
Estimation Settings |
Number of iterations before using results = 10000 Number of draws to be used for each respondent = 10000 |
After you have checked these settings and have clicked OK to close the HB Settings dialog, click Run. HB takes a lot longer than aggregate logit to run, often 5 to 10 minutes for medium-sized CBC problems. This is a smaller problem and only takes about a minute. Prior to the first iteration, the part-worth utilities are all initialized to zero for each respondent. HB takes 1000s of iterations to accomplish its work. The first 10000 iterations (by default) are "prior to convergence" and are not used. Then, the last 10000 iterations (by default) are used to estimate each respondent's preferences. If you watch the graphical output of the part-worth utilities plotted by iteration, you will notice that they tend to vary quite a bit and "wiggle" up and down (but with no noticeable trend) even after convergence is achieved. The simplest way to use the data is to average the utility estimates across the last 10000 iterations, per respondent, to create summary "point estimates" for each level of each attribute.
When HB estimation finishes, the following summary report is displayed:
CBC/HB Report Results Summary |
|
|
|
|
|
Study Name |
cbc |
|
Exercise Name |
CBCgolfexercise |
|
Number of Respondents |
250 |
|
|
|
|
Average Utilities (Zero-Centered Diffs) |
Average Utilities |
Standard Deviation |
High-Flyer Pro, by Smith and Forester |
24.60114 |
25.82170 |
Magnum Force, by Durango |
33.46895 |
29.19733 |
Eclipse+, by Golfers, Inc. |
-26.16204 |
24.78739 |
Long Shot, by Performance Plus |
-31.90805 |
22.25404 |
Drives 5 yards farther than the average ball |
-61.71370 |
13.20863 |
Drives 10 yards farther than the average ball |
14.58730 |
10.49875 |
Drives 15 yards farther than the average ball |
47.12640 |
9.60659 |
$4.99 for package of 3 balls |
59.63646 |
17.97828 |
$6.99 for package of 3 balls |
1.34627 |
12.16113 |
$8.99 for package of 3 balls |
-22.03700 |
11.94043 |
$10.99 for package of 3 balls |
-38.94573 |
18.85565 |
NONE |
-25.59380 |
14.49006 |
|
|
|
Average Importances |
Average Importances |
Standard Deviation |
Brand: |
29.72432 |
10.47899 |
Performance: |
36.30752 |
6.84552 |
Price: |
33.96817 |
10.28669 |
<<The above average utilities are rescaled utilities using the zero-centered "diffs" method. The diffs method rescales utilities so that for each individual the total sum of the utility differences between the worst and best levels of each attribute across attributes is equal to the number of attributes times 100.>>
The individual-level utilities (both the zero-centered diffs and the raw utilities) are available on additional tabs of this report. Raw utilities are on a much smaller scale than zero-centered diffs and are appropriate for conducting the transformations involved in converting raw attribute utilities to shares of preference for whole product concepts in the market simulator. The raw, individual-level utilities are the scores that Lighthouse Studio automatically takes forward for use in the market simulator.
For more information on HB, see the section on Estimating Utilities with HB.
It is very important that you learn how to interpret part-worth utilities properly. Please see a document entitled "Interpreting Conjoint Analysis Data" available in our Technical Papers library at http://www.sawtoothsoftware.com/support/technical-papers.
Running Market Simulations
Once you have computed HB utilities, you can use those within the choice simulator (often called the market simulator) to predict choices for any combination of products defined using the attributes and levels you measured. You can test what-if scenarios, conduct sensitivity analysis, and predict interest in different product concepts in competitive scenarios. Sawtooth Software offers two market (choice) simulators: a web-based simulator (designed for streamlined client use) and the more technically capable desktop-installed simulator available within the Lighthouse Studio interface. For the purposes of this tutorial, we will demonstrate the use of the integrated choice simulator.
To open the Choice Simulator, click Analysis | Simulator or click the Choice Simulator icon ![]() from the ribbon bar.
from the ribbon bar.
The first time you enter the Simulator for a study, the list of Simulation Scenarios (arranged as tabs in the interface) is empty.
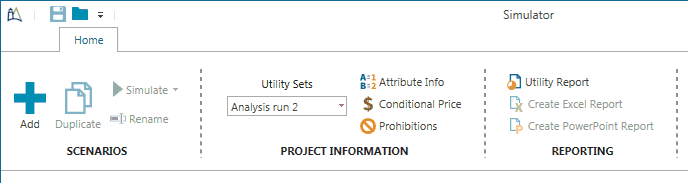
Create a simulation scenario by clicking Add....
When you click the Add... button, a new tab is added to the interface.
Recall that one of the reasons for including fixed holdout tasks in your survey was to check the accuracy of the choice simulator. We use the simulator to predict the outcome of a choice task that wasn't included when estimating the attribute utilities. To check this, you decide to specify the first fixed product scenario.
The first step is to change the default scenario name (in the tab of the folder). Double-click the name of the scenario (currently by default My Scenario) and type instead Fixed Holdout Task 1.
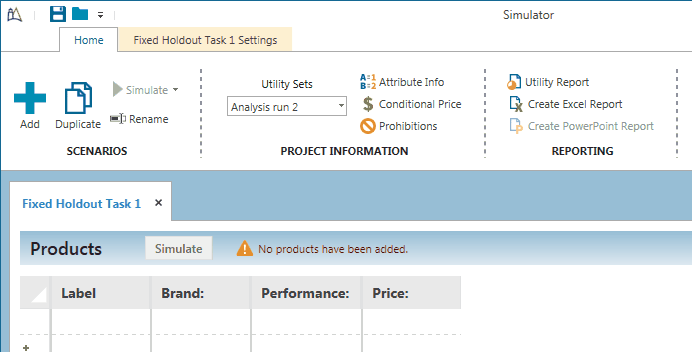
Next, you'll specify the three products that were included in that choice task. The area you specify the products looks like the grid of a spreadsheet. The first column is where you type the product label. As you double-click the various cells in the grid associated with the attribute levels for your different products, the levels will appear in the window below to remind you what levels are associated with each attribute's levels.
The easiest way to select a level to assign to a product is to double-click the cell in the grid and select an attribute label so that the level text appears in the grid. But, you may also type the level value of the attribute if you prefer to just manage the grid using numbers as attribute descriptions. Sometimes you may prefer to use numbers, for example, if you want to interpolate between levels included in your CBC experiment and specify some value between two levels you measured.
The attribute level codes for the three products that were shown in the first holdout fixed task were:
Product Name |
Brand |
Performance |
Price |
High-Flyer Pro |
High-Flyer Pro, by Smith and Forester |
Drives 15 yards farther than the average ball |
$10.99 for package of 3 balls |
Long Shot |
Long Shot, by Performance Plus |
Drives 10 yards farther than the average ball |
$6.99 for package of 3 balls |
Magnum Force |
Magnum Force, by Durango |
Drives 5 yards farther than the average ball |
$8.99 for package of 3 balls |
Specify these three products in the product entry grid.
After you have specified these three products, the display should look like:
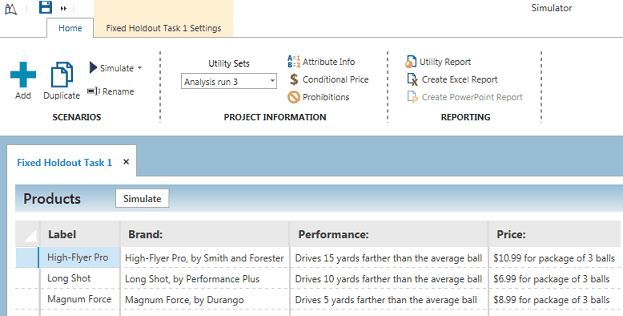
There are a few other things we should do before running the simulation.
We should select the utility run we want to use for the simulation. If you have have been performing all the steps above in this tutorial, you currently have three Analysis runs in the Utility Sets: your Counts analysis, your main effects logit run, and your HB run. Let's use the third run you specified (the HB run), which if you used the default name is called Analysis run 3.
Next, we need to specify a simulation method. We'll use the default approach called Randomized First Choice. If we wanted to change or review the settings associated with Randomized First Choice, we would click the Fixed Holdout Task 1 Settings tab (the tab to the right of the Home tab) in the ribbon bar.
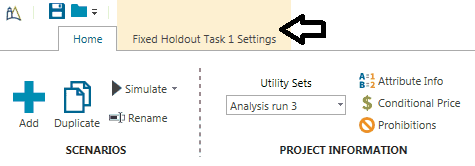
You may click the Fixed Holdout Task 1 Settings tab to examine some of the options on that dialog (though we won't make any changes for the purpose of this tutorial), then return to the Home tab to run the choice simulation.
From the Home tab, click the Simulate button to run the choice simulation.
The following report is displayed:
Shares of Preference |
|
|
|
|
Respondent Count |
250 |
|
|
|
|
|
|
|
|
Label |
Shares of Preference |
Std Error |
Lower 95% CI |
Upper 95% CI |
High-Flyer Pro |
56.38% |
1.64% |
53.18% |
59.59% |
Long Shot |
21.77% |
1.27% |
19.29% |
24.25% |
Magnum Force |
9.48% |
0.76% |
7.99% |
10.97% |
None |
12.36% |
0.49% |
11.40% |
13.33% |
If respondents faced a choice situation involving these three golf ball concepts (with their performance characteristics and prices as you have specified) versus the None, 56.38% of the respondents would be expected to choose High-Flyer Pro, 21.77% Long Shot, 9.48% Magnum Force, and 12.36% would be expected to choose the None.
The standard errors and upper and lower 95% confidence intervals are also displayed.
In the table below, for the first holdout task we've summarized the actual observed choices (from the questionnaire data) and predicted choice shares (from the market simulator operating on the HB utilities which were estimated using the responses to the 12 experimentally designs choice tasks). Notice that the simulated shares of preference are very similar to the actual share of choices respondents gave to fixed holdout task number one (which we analyzed earlier using Counts):
Product Name |
Actual Choice Shares |
Simulated Choice Shares |
Absolute Error |
High-Flyer Pro |
55.6 |
56.4 |
0.8 |
Long Shot |
20.0 |
21.8 |
1.8 |
Magnum Force |
7.6 |
9.5 |
1.9 |
None |
16.8 |
12.4 |
4.4 |
To quantify how closely the simulated shares match the actual choice shares, we've computed the absolute value of the difference between the actual and simulated shares in the last column. If we average the errors in the last column, we find the Mean Average Error (MAE) is 2.2.
We won't take the space here to show the MAE computation for holdout task #2, though you may decide to specify another simulation scenario and compute predicted shares for that task.
You can use MAE (or Mean Squared Error) to compare the results of different simulation models (i.e. Logit versus Latent Class or HB). You can also use it to tune the scaling parameter (exponent) or other advanced settings covered in more depth in the online help.
The Choice Simulator is a powerful tool for testing nearly an unlimited number of possible market scenarios. You can use the simulator to answer the strategic questions related to the fictitious golf ball situation posed at the beginning of this unit.
For example, the main question facing Performance Plus was whether they could hope to compete with the two existing performance balls in this market. The simulation results suggest that if they were able to provide the specified performance at the simulated price and could achieve the level of distribution and awareness of the existing brands (whose specifications and prices didn't change) they could expect a market share much higher than Magnum Force and lower than the leader, High-Flyer Pro.
A secondary question was whether they should market their new golf ball under the "Eclipse+, by Golfers Inc." name. If you specify the second holdout task as a new simulation scenario, the following shares result (displayed next to the previous simulation for fixed holdout task #1):
Simulated Shares of Choice |
|||
Fixed Task 1 |
Fixed Task 2 |
||
High-Flyer Pro |
56.4 |
High-Flyer Pro |
55.1 |
Long Shot |
21.8 |
Eclipse+ |
24.1 |
Magnum Force |
9.5 |
Magnum Force |
9.2 |
None |
12.4 |
None |
11.7 |
By marketing their ball under the "Eclipse+, by Golfers, Inc." name instead of "Long Shot, by Performance Plus", share of choice increases from 21.8 to 24.1, representing a 11% relative increase. Earlier in this tutorial, we inferred from Counting analysis a 10% improvement in choice likelihood due to the Eclipse+ brand name. Examining just the two holdout tasks suggested even greater gain for using the Eclipse+ brand name. The simulated shares, however, leverages more information (all 12 "random" tasks), utilizes a better model (HB) and better realism via market simulation of competitive scenarios, and therefore should be more accurate.
It is important to remember that the shares of preference resulting from conjoint predictions are not equivalent to actual market shares, and often look quite different. Many other factors in the real world factor into market shares and cannot be measured and reflected solely by conjoint data. Conjoint assumes perfect information, equal distribution and availability, and that each respondent is in the market and able to purchase. Conjoint results reflect the potential market acceptance, given proper promotion, distribution and time.