The previous example dealt with a simple, if not trivial, problem. In this example, we’ll introduce the element of competition. When multiple product alternatives are considered, a share simulation is appropriate. For most share simulation cases, we’d generally recommend using the Randomized First Choice simulation method. But, simulations using Randomized First Choice take considerably longer than the other techniques. For the purposes of illustration, so you don’t lose unnecessary time if following along in the software, we’ll employ the Share of Preference simulation.
For this illustration, we’ll use the “TV” data set that we often use in our CBC training workshops. This CBC project was conducted during the 1990s, so the attributes and levels for mid-range television sets will seem old by today's standards.The subject matter is features of mid-size television sets for the
The attributes, levels, and average part worths (shown in zero-centered diffs scaling) are:
Label |
Utility |
|---|---|
JVC |
-33.72 |
RCA |
-1.71 |
Sony |
35.43 |
|
|
25" screen |
-29.23 |
26" screen |
0.07 |
27" screen |
29.16 |
|
|
Mono sound |
-69.98 |
Stereo sound |
24.84 |
Surround sound |
45.14 |
|
|
No channel blockout |
-26.29 |
Channel blockout |
26.29 |
|
|
No picture in picture |
-32.64 |
Picture in picture |
32.64 |
|
|
$300 |
53.19 |
$350 |
30.74 |
$400 |
-20.06 |
$450 |
-63.88 |
Let’s assume an existing market, with the following four product offerings, and existing relative market shares (Share of Preference model):
Product #1
4.6% |
Product #2
12.7% |
Product #3
36.8% |
Product #4
45.9% |
|---|---|---|---|
JVC 25" screen Mono sound No blockout No PIP $300 |
JVC 26" screen Stereo sound Blockout No PIP $350 |
Sony 26" screen Stereo sound No blockout PIP $350 |
Sony 27" screen Surround sound Blockout PIP $450 |
We see that JVC offers a stripped-down, least expensive, model (Product #1), Sony is currently offering a full-featured expensive version (Product #4) that captures the highest share, and both JVC and Sony are offering mid-range offerings (Products #2 and #3).
Let’s imagine that you represent RCA, and RCA wishes to enter this market. RCA is urging you to price the new offering at $390. You must answer two questions:
1.Given the existing competition, and a price of $390, what is the optimal product to maximize share?
2.Assuming a total market size of 1MM units sold, what is the optimal product to maximize revenue (Relative Share x Price)?
First, we’ll deal with the question, “Which product can RCA offer for $390 to maximize share?” This is a tiny problem, with only 36 remaining combinations to be searched (after holding brand and price constant). Therefore, Exhaustive Search is appropriate. ASM tries all 36 possible combinations, and returns the following optimal product configuration:
RCA
27" screen
Surround sound
Channel blockout
PIP
$390
Share = 36.7%
This result is not very surprising, since it simply involved choosing the best features of remaining attributes (those attributes beyond the brand and price which we both fixed).
Optimizing Revenue
The second question posed earlier was how to price an optimal RCA-branded TV to maximize overall revenue. Using the standard simulation mode with the market simulator, we can compute shares of preference for the “optimal” product found in the previous section at various prices. And, assuming a total number of units sold of 1MM to the market (which you can specify under the Home tab, Revenues and Costs area), we can calculate total revenue to RCA at each price point (revenue = price x share x units sold):
Price |
Share |
Revenue |
|---|---|---|
$300 |
55.386564% |
$166,159,692 |
$325 |
51.984198% |
$168,948,644 |
$350 |
48.362694% |
$169,269,429 |
$375 |
40.925825% |
$153,471,844 |
$400 |
34.143952% |
$136,575,808 |
$425 |
28.047012% |
$119,199,801 |
$450 |
22.685924% |
$102,086,658 |
If evaluating every $25 increment, the highest revenue is achieved at $350. However, we can also use the ASM to search for this automatically. Furthermore, we can have the ASM interpolate across many more price points along the price continuum of $300 to $450.
For search methods in the ASM, you can use the =Range (Min_Price, Max_Price, Step_Value) instruction to declare a step value for investigating interpolated price increments between the prices you included in your attribute list. The number of steps used is controlled using the interpolation step value. For example, a step value of 5 means to increment the attribute level by 5 for each step. We'll use the instruction "=Range (300,450,5)" to search among all prices from $300 to $450 at $5 increments.
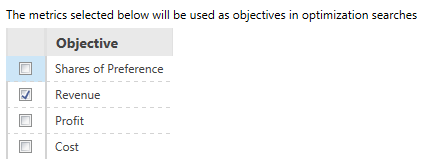
On the My Scenario Settings dialog, specify that the range behavior should be Search - Exhaustive (this is such a small problem that it makes sense to search all possible prices for this product). Next, we need to specify the goal for the search, which is revenue optimization. Click the gear icon ![]() to the right of Range Behavior field. Click Revenue as the single objective to maximize.
to the right of Range Behavior field. Click Revenue as the single objective to maximize.
Using Search - Exhaustive, click Simulate and we find that the optimal price is $345 for the RCA product to maximize revenue of $169,296,870. The top results are sorted from highest to lowest in terms of total revenue (the first seven are shown below):
Result |
Price |
Share |
Revenue |
|---|---|---|---|
1 |
$345 |
49.071556% |
$169,296,870 |
2 |
$340 |
49.791886% |
$169,292,413 |
3 |
$350 |
48.362694% |
$169,269,428 |
4 |
$335 |
50.520590% |
$169,243,975 |
5 |
$330 |
51.253256% |
$169,135,745 |
6 |
$325 |
51.984198% |
$168,948,644 |
7 |
$320 |
52.706811% |
$168,661,794 |
Of course, each of these estimates of revenue involve error, so the ASM can report 95% confidence intervals. If we specify a product simulation with RCA's product at $345 (with the other 4 competitive products as shown above), and run that single simulation, a 95% confidence interval for Revenue is reported on the "Details by Metric" tab of the output. The 95% confidence interval for the Revenue prediction for this RCA product is the interval [$155,072,442, $183,521,297].
This revenue-maximizing prediction for RCA says nothing about profit. RCA may end up losing money by producing and selling this feature-rich TV at $345. To conduct simulations for profit maximization, we need to know how much it would cost RCA to produce this (and other) products with the attributes and levels included in our study. Profit maximization is covered in a different search example in this documentation.
A Note on Standard Errors
For ease of computation, we calculate the standard error of any net revenue, share, utility, or profit for multiple products using the formula for “pooled standard error.” For example, considering products a and b, the standard error of the sum (shares, revenues, etc.) of products a and b is equal to:
SEa+b = sqrt (SEa2 + SEb2 )
Because the shares for a and b are usually negatively correlated in market simulations, this estimate provides a more conservative (slightly larger) value than if the standard error were computed on a new variable representing the net sum for a and b.