We’ll begin with a simple illustration that doesn’t involve a “market simulation” at all, but focuses on finding a single product configuration to maximize average utility for the population. This, admittedly, is a problem that doesn’t require an optimization routine. But for the purpose of illustration, we’ll begin with the simple case. Imagine you are creating a new product to introduce to a market without any established competition.
We’ll refer to a data set that we often use in our CBC training workshops, the "TV" data set. This CBC project was conducted during the 1990s, so the attributes and levels for mid-range television sets will seem old by today's standards.
The average raw HB utilities across 250 respondents are as follows:
Label |
Utility |
|---|---|
JVC |
-0.64 |
RCA |
-0.04 |
Sony |
0.68 |
|
|
25" screen |
-0.61 |
26" screen |
0.02 |
27" screen |
0.59 |
|
|
Mono sound |
-1.57 |
Stereo sound |
0.56 |
Surround sound |
1.01 |
|
|
No channel blockout |
-0.56 |
Channel blockout |
0.56 |
|
|
No picture in picture |
-0.71 |
Picture in picture |
0.71 |
|
|
$300 |
1.11 |
$350 |
0.64 |
$400 |
-0.41 |
$450 |
-1.34 |
With this array of attributes and levels, there are 3x3x3x2x2x4 = 432 possible product combinations. Let’s assume your brand is fixed: you are Sony. With brand fixed, there are now 1x3x3x2x2x4 = 144 remaining combinations.
If the goal is to provide the single, most appealing product to the market (assuming no competition) without regard to cost, the optimal product is trivial. After brand (Sony), one selects the most preferred level on average from each remaining attribute:
Label |
Utility |
|---|---|
Sony |
0.68 |
27" screen |
0.59 |
Surround sound |
1.01 |
Channel blockout |
0.56 |
Picture in picture |
0.71 |
$300 |
1.11 |
|
|
Total: |
4.66 |
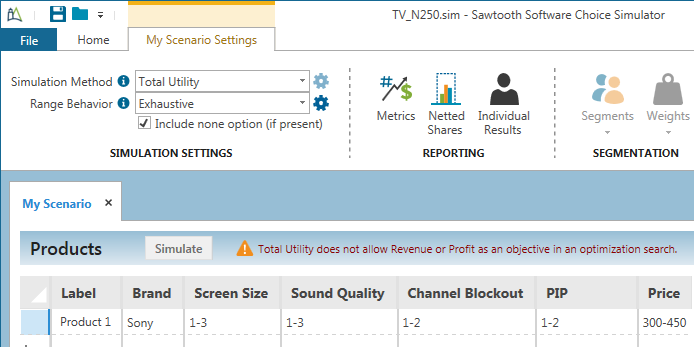
Even though the answer is trivial, we can use the ASM to search for this result. We use the following My Scenario Settings specifications (note that we previously assigned level values for Price from 300 to 450 by using the Attribute Info dialog such that 300 maps to level 1 of price, 350 maps to level 2 of price, etc.):

(Note that we could have used the Range function as well when defining the attribute levels to search. For example, rather than typing 1-3, we could have typed =Range(1,3). The Range function gives ability to specify interpolated step sizes between the levels we included in the questionnaire, but we won't do that for this example.
We click Simulate and the top results are shown (we've shown just the top 6 below):
Simulation Results |
|
|
|
|
|
|
|
|
|
|
|
|
|
|
|
Result |
Total Utility |
Brand |
Screen Size |
Sound Quality |
Channel Blockout |
PIP |
Price |
1 |
4.66 |
Sony |
27" screen |
Surround sound |
Channel blockout |
Picture in picture |
$300 |
2 |
4.20 |
Sony |
27" screen |
Stereo sound |
Channel blockout |
Picture in picture |
$300 |
3 |
4.19 |
Sony |
27" screen |
Surround sound |
Channel blockout |
Picture in picture |
$350 |
4 |
4.09 |
Sony |
26" screen |
Surround sound |
Channel blockout |
Picture in picture |
$300 |
5 |
3.73 |
Sony |
27" screen |
Stereo sound |
Channel blockout |
Picture in picture |
$350 |
6 |
3.63 |
Sony |
26" screen |
Stereo sound |
Channel blockout |
Picture in picture |
$300 |
This is a simple problem with just 144 possible combinations and it computes very rapidly. In cases where there are relatively few possible combinations, exhaustive search is feasible, and it guarantees finding the global optimum.
The optimal product is the one we previously identified by selecting (other than Sony) the most preferred level from each attribute. As we calculated from the report of average utilities, the average utility for this optimal product is 4.66.
The next-best product alternatives are shown in sort order by total utility below the top result. The next-best product has a utility of 4.20. The only difference for this product is that the Sound Quality is "Stereo" instead of "Surround sound".