Creating a Sawtooth Software Account
If you aren't already registered to use Lighthouse Studio with a Sawtooth Software Account, the first time you launch the software (Start | Programs | Sawtooth Software | Sawtooth Software Lighthouse Studio) you are shown a dialog wherein you specify your Email and a Password and click Create New Account. After creating the account you will receive an email asking you to confirm account creation by following the link in the email. Once your account is confirmed, return to the software to Sign in.
When signed in to your Sawtooth Software Account you will see your account email address at the upper-right hand side of the application. You can click on that link to view your license information, go to your account online, or sign out.
Introduction
This tutorial leads you step-by-step through a simple MaxDiff study, from thinking about a research problem and planning a questionnaire to entering a list of MaxDiff items in Lighthouse Studio, generating and testing the questionnaire, and analyzing the results.
Lighthouse Studio is a powerful program, and this tutorial only touches on the basics for running a MaxDiff experiment. You'll become aware of different or more sophisticated approaches by reading other sections in the on-line help and by experimenting with Lighthouse Studio.
(Note: this example is based on a presentation delivered at the 2003 Sawtooth Software Conference by Amanda Kraus, Diana Lien, and Bryan Orme. Though many of the items we use in this example are identical to the ones used in the conference presentation, the data we have developed for this example are purely fictional. The suggested steps represent one approach to this type of research problem, but may not necessarily reflect the single "best" way to conduct such a research study using Lighthouse Studio.)
The Research Problem
As the economy improved in 2003, the Navy faced declining reenlistment rates among its sailors. The Navy is looking for ways to improve the reenlistment rate. Previous research has shown that reenlistment terms, quality of life issues, and the work environment are all significant factors when sailors face the reenlistment decision. Pure economic aspects matter as well, such as the amount of the reenlistment bonus. It's 2003 and you have been brought on as a consultant to help the military design and execute a research study to prioritize a list of possible job and quality of life enhancements as well as reenlistment terms. The Navy is keenly interested in how reenlistment bonuses may affect sailors' desire to enlist relative to other non-monetary issues. Those improvements which are most likely to increase the reenlistment rates at the lowest expense to the military should be implemented first. They would like to implement this study over the Web, and expect that between 1,000 and 2,000 sailors might complete the study.
At first, you consider whether a conjoint method such as CBC would be appropriate. You ask your military client, Jane, if the resulting model needs to be able to project the likely reenlistment rate when combinations of job enhancements are taken together. Jane assures you that although that type of analysis would be of interest to military planners, the primary consideration is the ability to prioritize the items from most to least effective in terms of improving reenlistment rates. The planners need to be able to directly compare the effect of each job enhancement or monetary bonus.
After pondering the problem, you recognize that a strength of MaxDiff is its ability to place multiple items on the same scale using a trade-off methodology. With conjoint analysis (such as CBC), the client would not be able to directly compare the preference for levels of one job-related item to another. MaxDiff doesn't formally support adding the preference scores across items and predicting the overall benefit of the job package or likelihood of reenlistment given a specific job package (as would CBC), but that is not a requirement for the study. Therefore, you decide to use MaxDiff.
Developing a List of Items
You meet with Jane to discuss the elements (items) to be studied in the MaxDiff exercise. Jane explains that a series of focus groups had been conducted over the last four months wherein the reasons for reenlistment versus leaving the Navy were discussed. Hundreds of ideas had been presented, but there seemed to be some common themes. Furthermore, Jane had discussed the myriad ideas with military planners. Many of the ideas were clearly off-the-table (such as "king-sized beds on submarines," "more parties," and "supermodels as supervisors"). However, there were a number of areas of overlap: job conditions that the military was in the position to change and those that also were on the minds of the sailors.
The list included the following:
•Length of reenlistment obligation
•Location or duty assignment guarantees for next assignment
•Faster promotion
•Living conditions when in port (2-person barracks vs. 4-person barracks)
•Increase in sea pay
•Percent of on-job time using your skills and training
•Time off each week allowed for on-line college coursework
•Online career counseling services
•Personal counseling services
•Reenlistment bonus
This looked like a good start, but it seemed obvious to both you and Jane that some further refinement and quantification of benefits was needed. The items needed to carry specific meaning to the sailors and the results needed to be actionable for the military planners. Most of the items seemed to require multiple levels, whereas some seemed to stand on their own. After thinking about the reasonable items (and some back-and-forth with Jane's internal clients, the military planners) a final list was drawn up:
Factors Affecting Reenlistment Decision:
3-year reenlistment obligation
5-year reenlistment obligation
Location guarantee for next assignment
Duty guarantee for next assignment
Both location and duty guarantees for next assignment
Get promoted 6-months sooner than expected
Live in 2-person barracks when in port
Live in 4-person barracks when in port
Choice between living in 2-person barracks or 4-person barracks when in port
$50 per month pay increase when out at sea
$75 per month pay increase when out at sea
Half of on-job time using your skills and training
Three-quarters of on-job time using your skills and training
Time off each week allowed for on-line college coursework
Receive online career counseling services
Receive in-person personal counseling services
Receive phone-based personal counseling services
Current reenlistment bonus ($2,500)
Increased reenlistment bonus ($5,000)
Increased reenlistment bonus ($10,000)
Next, you worked with Jane to decide which items would need to be prohibited from displaying with each other versus which could freely combine with all other items within the same set. For example, it would not make sense to ask sailors to choose between a $50 pay increase versus a $100 pay increase when out at sea. Every rational sailor would choose higher pay over lower, so this would be a wasted comparison. Other items such as living in a 2-person barracks versus a 4-person barracks didn't seem to have a rational preference order (though having a choice between 2-person barracks or 4-person barracks would seem to be preferred to no choice). Perhaps some sailors would prefer to live with more people, whereas others would prefer just one roommate.
You organized the list into groupings of items (listed as groups A through F), where the items within groups A through E would require at least some prohibitions (restrictions that they could not be displayed together within the same choice set).
A) Prohibit these two items:
3-year reenlistment obligation
5-year reenlistment obligation
B) Prohibit third item with appearing with either item 1 or item 2:
Location guarantee for next assignment
Duty guarantee for next assignment
Both location and duty guarantees for next assignment
C) Prohibit third item with appearing with either item 1 or item 2:
Live in 2-person barracks when in port
Live in 4-person barracks when in port
Choice between living in 2-person barracks or 4-person barracks when in port
D) Prohibit these two items:
$50 per month pay increase when out at sea
$75 per month pay increase when out at sea
E) Prohibit these items from appearing together:
Current reenlistment bonus ($2,500)
Increased reenlistment bonus ($5,000)
Increased reenlistment bonus ($7,500)
F) No prohibitions with other items:
Half of on-job time using your skills and training
Three-quarters of on-job time using your skills and training
Get promoted 6-months sooner than expected
Time off each week allowed for on-line college coursework
Receive online career counseling services
Receive in-person personal counseling services
Receive phone-based personal counseling services
Scripting the Questionnaire
A real research project would involve other questions about each sailor, including gender, current rank or job specification, current location, inclination to reenlist, etc. Standard survey questions (such as select questions with radio buttons or check-boxes) can be developed within Lighthouse Studio (of which MaxDiff is a subcomponent). Rather than take time within this tutorial to add such classification questions, we'll focus on the MaxDiff section of the survey. Interested users can look to the Lighthouse Studio Tutorial within this same online help and manual for further help with standard survey questions.
You decide to include the following introductory text leading into the MaxDiff questions:
Start:
Thank you for taking time to help the Navy consider ways to improve your working environment and career development. Our goal is to make the Navy a satisfying career for you and to improve your desire to reenlist when the decision arises.
We would like you to imagine that you are facing the decision whether to reenlist or not--today. Please think about the issues involved, including future career planning, family/relationship considerations, job location, and compensation.
Click the Next button below to continue... |
IntroMaxDiff:
If you were making the decision to reenlist or not today, there would certainly be many factors that affect your decision to reenlist or not. Real life decisions are not always easy.
We want to gain some insight into how you make this decision by asking you to evaluate a series of tradeoff scenarios. In each scenario, we'll show you four possible factors affecting your career in the Navy and the reenlistment decision.
We'll ask which factor (among this set of four) would make you most want to reenlist, and which would make you least want to reenlist.
We need to ask you repeated tradeoff scenarios (involving different factors each time) so that we can learn what is truly important to you when deciding whether to reenlist.
|
Layout for MaxDiff Questions
Next, you need to decide the layout of the MaxDiff questions. Research has suggested that showing more than about five items at a time in MaxDiff questions may not be very beneficial. Some of the items in your study are a bit on the wordy side, so you decide to show just four items at a time.
The MaxDiff documentation suggests showing each item between 3 to 5 times on average per respondent across the sets. With 20 items in the study, the number of questions to display so that each item is shown on average 3 times per respondent is equal to:
3(K/k)
where K is the total number items in the exercise, and k is the number of items per set
Therefore, you would need to ask each respondent a minimum of 3(20/4) = 15 sets. The "nice to have" number of sets would be 5(20/4) = 25. After discussing with the client, you decide that respondents should be able to complete 20 sets with little problem (each item displayed on average 4 times to each respondent). You estimate that each set will take about 20 seconds to complete (prior research presented at the Sawtooth Software Conference reports that figure), for a total average interviewing time of between 6 to 7 minutes for the MaxDiff section.
To try to keep respondents engaged and working productively through the MaxDiff exercise, you plan to show respondents a progress bar and also provide a count-down message regarding how many tasks remain.
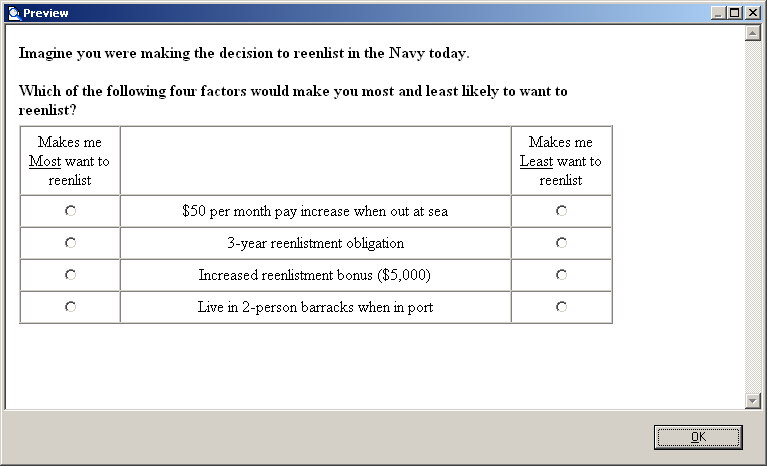
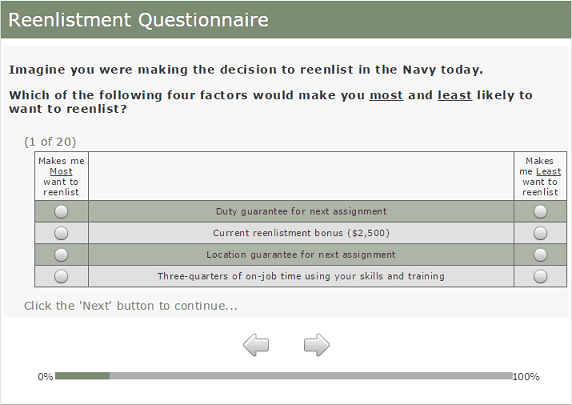
Here's an example of the MaxDiff question layout you plan to use:
After the fifth MaxDiff question, you plan to show some text that provides encouragement and a countdown, such as:
ProgressCounter:
Good work so far. We know that some of these tradeoffs are challenging.
We need to ask you to evaluate 15 more sets so that we can better determine how you make your reenlistment decision.
|
And at the end, you want to display a screen that thanks respondents, and then immediately sends them to a Navy site www.navy.mil.
Finish:
Thank you very much for your help. Your data will be used to help Navy planners as they work to make the Navy an even better career choice.
Click the Next button to finish submitting your data and to return to the Navy's official website. |
Using Lighthouse Studio to Write the Questionnaire
Start by opening the Sawtooth Software Lighthouse Studio. If you have a standard installation, you start it by clicking Start | Programs | Sawtooth Software | Sawtooth Software Lighthouse Studio. MaxDiff is one component within that software program. (Although not emphasized here, MaxDiff may be used for conducting paper-based MaxDiff projects.)
After starting Lighthouse Studio, choose File | New Study…. The New Lighthouse Study dialog appears, with your cursor active in the Name field.

The Location field lists the folder (directory) that Lighthouse Studio currently is using to store studies. You can use any folder you like for this tutorial project. You can browse to and create new folders by clicking the Browse... button to the right of the Location field, and then (after browsing to the folder in which you want to create a new sub-folder to contain this study) by clicking the "new folder" icon. Each studyname in Lighthouse Studio has a maximum number of twenty-four characters (either letters or numbers), and Lighthouse Studio requires that the study be located within its own folder. The folder that Lighthouse Studio automatically creates for your study also carries the same name as the study. For this tutorial, you might create a name such as navyproject. From the New Lighthouse Study dialog, specify navyproject as the studyname.
Click the OK button. You are returned to the main menu, and a new "Study Navigator" window is displayed.
As you work with this study, items appear in the Study Navigator window, listing the functional areas you have been using or that are now available to you. This list of items provides a Shortcut link to access those parts of Lighthouse Studio. Alternatively, you can access those same areas by clicking icon buttons on the toolbar or by using the pull-down menus.
Adding the Introduction Screens to the Survey
(If you are already familiar with the Start (passwords) question, Text and Select questions within Lighthouse surveys, you may choose to skip forward to the section entitled "Adding MaxDiff Questions to the Survey").
Let's enter the introductory text using the Write Questionnaire dialog. You can access the Write Questionnaire dialog by selecting Compose | Write Questionnaire… or by clicking the "pencil" icon ![]() on the toolbar.
on the toolbar.
The introductory text and survey questions would most likely be initially developed within a word processing document. Assuming you really had such a document, you might press Ctrl-C to copy, and Ctrl-V to paste the information into Lighthouse Studio. We suggest you simply copy-and-paste the text within this document into your Lighthouse questions rather than re-type the text (if viewing this document with Acrobat Reader, you can use the "text select" icon ![]() from the Acrobat Reader toolbar.)
from the Acrobat Reader toolbar.)
The first question to compose is the introductory screen:
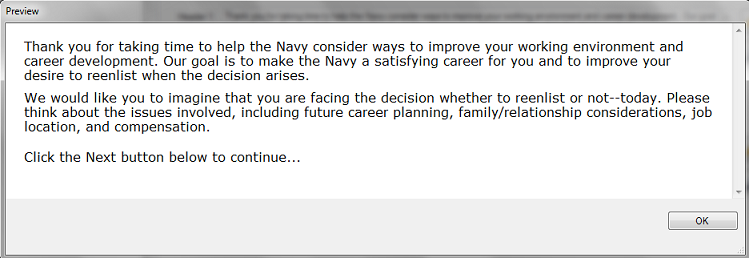
Start:
Thank you for taking time to help the Navy consider ways to improve your working environment and career development. Our goal is to make the Navy a satisfying career for you and to improve your desire to reenlist when the decision arises.
We would like you to imagine that you are facing the decision whether to reenlist or not--today. Please think about the issues involved, including future career planning, family/relationship considerations, job location, and compensation.
Click the Next button below to continue... |
We'll insert this introductory screen in the Start question that is automatically the first question of any Lighthouse survey. The Start question is also the place where you would ask respondents to type their passwords to access the survey. We'll not use passwords for this sample survey.
From the Write Questionnaire dialog open the Start question by highlighting it in the list of questions and clicking Edit.... Alternatively, you can double-click the Start question, and it automatically opens. The Questionnaire Access and Passwords dialog is displayed::
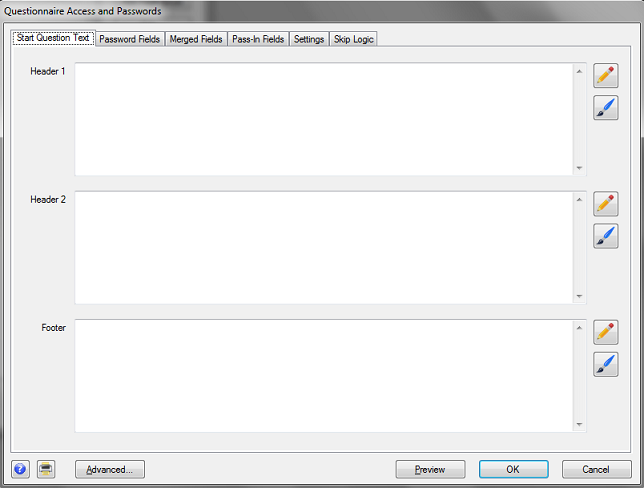
Most question types in Lighthouse Studio have "Header 1", "Header 2," "Body" and "Footer" sections. (The Start question has all but the "Body" section.) These are "text" areas in which you can insert any text (including HTML). When the question is viewed with a web browser, the sections are organized roughly as follows:
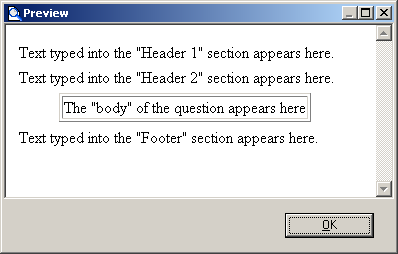
For this introductory screen (that includes three paragraphs of information), it seems to make sense to place the first paragraph in the "Header 1" area, the second paragraph in the "Header 2" area, and the third paragraph in the "Footer" area.
Type (or cut and paste) the following text for the Start question into the text areas in the Start question. Put the first paragraph in Header 1, the second paragraph in Header 2, and the third paragraph in Footer.
Thank you for taking time to help the Navy consider ways to improve your working environment and career development. Our goal is to make the Navy a satisfying career for you and to improve your desire to reenlist when the decision arises.
We would like you to imagine that you are facing the decision whether to reenlist or not--today. Please think about the issues involved, including future career planning, family/relationship considerations, job location, and compensation.
Click the Next button below to continue...
The main dialog only shows a portion of the text, but you can click the "pencil" icon ![]() adjacent to each text area to expand the text editing window.
adjacent to each text area to expand the text editing window.
To preview how the question will look when it runs on the respondent's computer, click the Preview button. The question is displayed in "Preview" mode (no data are saved, and no special "error checking" or "validation" is performed for the question).
Lighthouse Studio automatically places paragraph breaks (extra blank lines) between the Header 1, Header 2, and Footer sections. If you put all the text in a single section, you may see that when the web browser interprets the text, it all runs together without any blank lines between the paragraphs (unless you insert some HTML instructions to force blank lines between paragraphs). We'll talk about using HTML within your text to take greater control over the layout, font, and style later in this tutorial.
Click the OK button on the Preview window to close that window and return to the previous Lighthouse Studio dialog.
After viewing the text in preview mode, you might decide that it is really too small, or that you want to make the text bold. You can modify the font and sizes of the font using the Paintbrush ![]() icon. Or, you can select a different Style (selecting styles was described in the 45-minute tutorial for Lighthouse Studio). After changing any setting, click Preview again.
icon. Or, you can select a different Style (selecting styles was described in the 45-minute tutorial for Lighthouse Studio). After changing any setting, click Preview again.
After you are happy with the layout of the introductory screen, click OK to return to the Write Questionnaire dialog.
Remember that when you add a new question to the List of Questions, it is inserted directly below the question (or page break) that was highlighted when you clicked the Add... button. If you need to move a question once it has been added to the List of Questions, simply highlight the question to be moved and click the ![]() or
or ![]() buttons to move the questions within the list (you can also highlight a question and click Ctrl-X or Ctrl-C to cut or copy and Ctrl-V to paste questions within the current questionnaire, or even to another Lighthouse Studio study.)
buttons to move the questions within the list (you can also highlight a question and click Ctrl-X or Ctrl-C to cut or copy and Ctrl-V to paste questions within the current questionnaire, or even to another Lighthouse Studio study.)
Now, add a the second introductory screen on a separate page. The text for that screen is as follows:
If you were making the decision to reenlist or not today, there would certainly be many factors that affect your decision to reenlist or not. Real life decisions are not always easy.
We want to gain some insight into how you make this decision by asking you to evaluate a series of tradeoff scenarios. In each scenario, we'll show you five possible factors affecting your career in the Navy and the reenlistment decision.
We'll ask which factor (among this set of five) would make you most want to reenlist, and which would make you least want to reenlist.
We need to ask you repeated tradeoff scenarios (involving different factors each time) so that we can learn what is truly important to you when deciding whether to reenlist.
Note that there already is a page break following the Start question. Highlight the page break and click Add.... Select Text as the question type with IntroMaxDiff as the question name. Click OK to add the question to your survey.
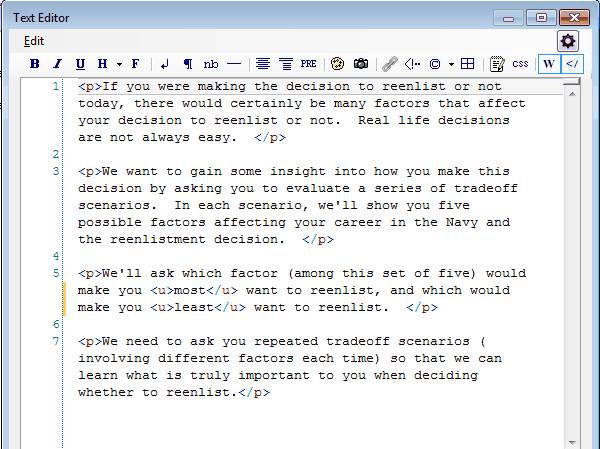
This introductory screen has four paragraphs and it also includes two words that need to be underlined (most and least). Therefore, we'll show you how to how to format text in HTML. While we're showing you how to add underlining to text, we will show you how to insert paragraph breaks as well.
Copy and paste the full text for the IntroMaxDiff question from this document into the Header 1 field. Next, click the "pencil" icon ![]() adjacent to the Header 1 text area to expand the text editing window. Highlight the first full paragraph with the mouse and click the "paragraph break" icon
adjacent to the Header 1 text area to expand the text editing window. Highlight the first full paragraph with the mouse and click the "paragraph break" icon ![]() which inserts the HTML text <p> at the beginning of the paragraph and </p> at the end of the paragraph. Repeat the same steps for all four paragraphs.
which inserts the HTML text <p> at the beginning of the paragraph and </p> at the end of the paragraph. Repeat the same steps for all four paragraphs.
Next, we need to underline the words most and least. Highlight "most" and click the "underline" icon ![]() . Repeat the same for the word "least". When you are finished, the dialog should look like:
. Repeat the same for the word "least". When you are finished, the dialog should look like:
Click OK to close the text editor dialog and Preview to see how it is displayed in the browser window.
At this point, we are ready to add the MaxDiff questions to the questionnaire.
Adding MaxDiff Questions to the Survey
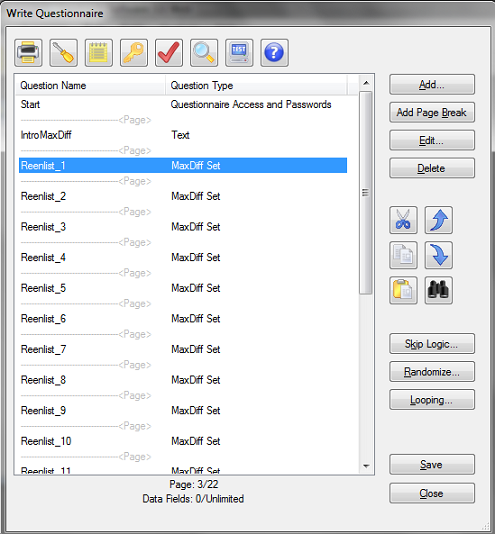
In this section, we'll add the MaxDiff questions to the survey, directly following the two introductory screens we previously added. From the Write Questionnaire dialog, insert a page break (click Add Page Break) beneath the IntroMaxDiff question. While the page break beneath IntroMaxDiff is highlighted, click Add... and select MaxDiff as the Exercise type. Click Add. Specify a name for this exercise, such as Reenlist. (Note: you can have more than one MaxDiff exercise within the same Lighthouse questionnaire. In this tutorial, we'll only insert a single exercise.) Click OK and the MaxDiff Exercise dialog is shown.
The MaxDiff Exercise dialog has six tabs:
Question Text (here you type the text to display directly above and below the question)
Label Text (here you specify the text to display directly next to the item text)
Items (here you specify the list of items in the exercise)
Format (you may format your questionnaire, including widths and colors from this tab)
Design (the number of items to display per set and number of sets is specified here)
Skip Logic (this dialog is inactive and only present for consistency with other dialogs in Lighthouse Studio)
We'll begin by specifying the 20 items used in this exercise within the Items tab. Click the Items tab. A list box is displayed which allows you to specify a new list of items to be used in this Lighthouse study. Or, you can select from an existing list of items. Since we have not yet specified a list within this study, we'll add a new one. By default, the list name is provided as ReenlistList. Let's go ahead and use this default name.
(Note that other options such as making items on the list "Other Specify" items or "None of the Above" options are available. These are for consistency with other dialogs in Lighthouse Studio, but are of no use in MaxDiff exercises.)
From this dialog, we could click the Add... button and type the items individually, but it is easier to copy-and-paste the list of items from an existing document. Copy-and-Paste the list of items by highlighting the items below...
3-year reenlistment obligation
5-year reenlistment obligation
Location guarantee for next assignment
Duty guarantee for next assignment
Both location and duty guarantees for next assignment
Get promoted 6-months sooner than expected
Live in 2-person barracks when in port
Live in 4-person barracks when in port
Choice between living in 2-person barracks or 4-person barracks when in port
$50 per month pay increase when out at sea
$75 per month pay increase when out at sea
Half of on-job time using your skills and training
Three-quarters of on-job time using your skills and training
Time off each week allowed for on-line college coursework
Receive online career counseling services
Receive in-person personal counseling services
Receive phone-based personal counseling services
Current reenlistment bonus ($2,500)
Increased reenlistment bonus ($5,000)
Increased reenlistment bonus ($10,000)
...and pressing Ctrl-C to copy them into the clipboard, and then switching to the Items tab and clicking the Paste list member(s) from the clipboard ![]() icon. The 20 items are all automatically inserted within the list.
icon. The 20 items are all automatically inserted within the list.
Next, we'll specify the text to display above the MaxDiff sets into the Question Text tab. Click the Question Text tab. Some default text is already available within this question. Paste the following text into the Header 1 field, replacing the default text:
Imagine you were making the decision to reenlist in the Navy today.
Which of the following four factors would make you most and least likely to want to reenlist?
Insert paragraph breaks and underlining as we showed you earlier in this tutorial.
Header 2 has some scripting commands that add a counter to each MaxDiff question: 1 of 20, 2 of 20, etc. We don't need to modify those scripting commands, so let's just leave it as is.
We are almost finished formatting the basics for our MaxDiff exercise. Click the Label Text tab, and type the labels to display over the radio buttons respondents click to indicate best and worst items. The text to use is as follows:
Best label: Makes me <u>Most</u> want to reenlist
Worst label: Makes me <u>Least</u> want to reenlist
Next, we need to tell Lighthouse Studio how many MaxDiff questions (sets) to display in the questionnaire. Click the Design tab. Basic design settings for your MaxDiff exercise are displayed:
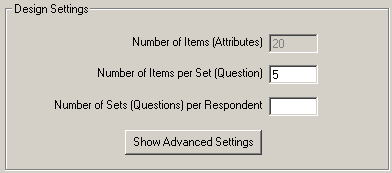
You may recall that we previously decided that each set would present 4 items at a time and that the respondent would receive 20 questions (so each item was shown four times on average). Specify 4 in the Number of Items per Set (Question) field. Specify 20 in the Number of Sets (Questions) per Respondent field.
At this point, we might preview the MaxDiff question to see how we are doing so far. Click the Preview button, and you may see something like this:
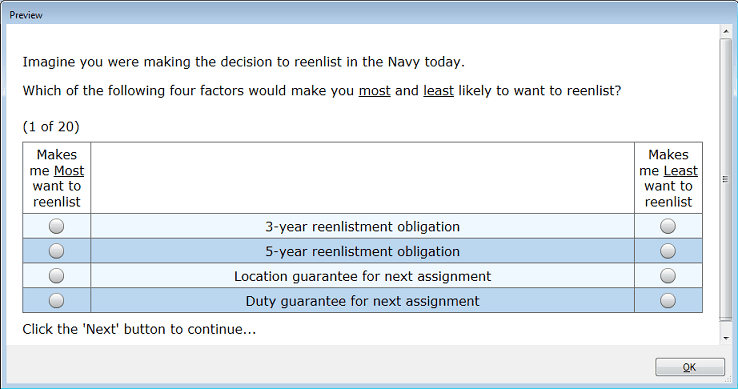
Note that by default the preview displays the first four items in our list therefore some of the items that we wanted to prohibit are being displayed together. We can add the prohibited combinations under this same Design tab.
Inserting prohibitions is a capability provided within the Advanced Settings on this dialog. (After retiring the Preview dialog) click Show Advanced Settings to reveal additional controls, including the Prohibitions... button.
Click the Prohibitions... button. We need to prohibit the following pairs of items for our exercise:
Prohibit this item... |
...from appearing with this item. |
3-year reenlistment obligation |
5-year reenlistment obligation |
Location guarantee for next assignment |
Both location and duty guarantees for next assignment |
Duty guarantee for next assignment |
Both location and duty guarantees for next assignment |
Live in 2-person barracks when in port |
Choice between living in 2-person barracks or 4-person barracks when in port |
Live in 4-person barracks when in port |
Choice between living in 2-person barracks or 4-person barracks when in port |
$50 per month pay increase when out at sea |
$75 per month pay increase when out at sea |
Current reenlistment bonus ($2,500) |
Increased reenlistment bonus ($5,000) |
Current reenlistment bonus ($2,500) |
Increased reenlistment bonus ($10,000) |
Increased reenlistment bonus ($5,000) |
Increased reenlistment bonus ($10,000) |
Click an item to prohibit from the list on the left, then click the item to prohibit from the list on the right. Continue picking items until all prohibitions have been specified. Click the OK button when finished.
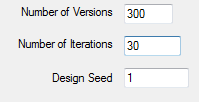
So that the designer runs quickly for the purposes of this tutorial, specify 30 iterations.
(Note: specifying prohibitions can cause the design algorithm to process much more slowly than if no prohibitions are specified. With the 9 prohibitions in this example, it takes about 10 minutes to run 1000 iterations of the design. Yet, the designs found with even 30 iterations are extremely good quality, so we recommend reducing the number of iterations attempted to 30 for the purposes of this tutorial.)
Now, we are ready to "generate the design." The design is all the combinations of items that respondents will see across their 20 choice sets (questions).
The sets need to be chosen carefully, so each item appears about an equal number of times, and that each item is shown about an equal number of times with every other item (non-prohibited item, that is). Click Generate Design, and the software tries 30 separate attempts (recall we reduced the attempts from 1000 to 30 to save time in this tutorial) to create a balanced experiment (using a different random number start each time). The best attempt is selected, and the results are shown to you in a design report.
When the computation finishes, you are shown a report (which you have the opportunity to save to a text file if you wish).
We'll explain the report, one step at a time. First, design specifications are reported:
Number of Items (Attributes): 20
Number of Items per Set: 4
Number of Sets per Respondent: 20
Number of Versions: 300
Number of Iterations: 30
Random Number Seed: 1
Number of Prohibitions: 9
Iteration 20 was chosen
Above, we see that the software made 30 total attempts (iterations) to generate a design plan, and the 20th attempt was chosen as "best." In total, the software created 300 versions of the questionnaire (where each version features different item combinations within the sets) to display to respondents. Multiple versions of the questionnaire are generated to improve the stability of the item scores and also to reduce psychological order and context effects that might occur if every respondent received the same combinations of items. Although you plan to interview 1000 or more respondents, it would probably be overkill to generate even more unique questionnaire versions. (Some might argue that 300 versions is already overkill!) Additional versions would provide imperceptibly little measurable benefit, though the software lets you specify up to 999 versions. Each respondent will receive one of these versions of the questionnaire, and many of the questionnaires will therefore be repeated.
Below, the one-way balance is reported. This shows how many times each item is displayed across all 300 versions of the questionnaire plan, where each version had 20 sets displaying 4 items at a time. If the design was perfectly balanced, each item would be displayed 1200 times. As can be seen, the design is indeed perfect with respect to one-way frequencies:
One Way Frequencies:
Item Times Used
----------------
1 1200
2 1200
3 1200
4 1200
5 1200
6 1200
7 1200
8 1200
9 1200
10 1200
11 1200
12 1200
13 1200
14 1200
15 1200
16 1200
17 1200
18 1200
19 1200
20 1200
Mean = 1200
Std Dev. = 0
The quality of the design is summarized as the standard deviation across the 20 reported frequencies, or 0 in this case (no deviation from perfection). This number is used to classify the quality of the design for multiple attempts (iterations) the software makes. Attempts that demonstrate a lower standard deviation across the frequency counts are deemed better.
Next, the report summarizes how many times each item appeared together with every other item within sets. Ideally, each item would appear an equal number of times with every other item. You may recall that we prohibited nine combinations from occurring, so there cannot be perfect balance. These prohibited combinations are shown with 0 frequency in the table below (for example, item 1 shown with item 2), highlighted in red.
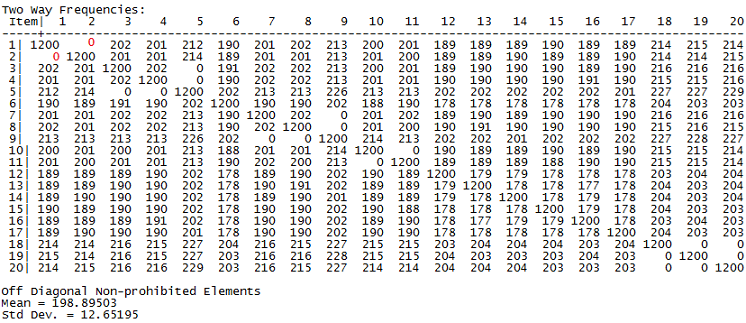
Although the balance in the non-prohibited cells is not nearly as good as the one-way counts (the nine prohibitions of course prohibited the MaxDiff designer from finding a balanced design), the results are still quite acceptable in practice. How would you know if you were in deep trouble due to prohibitions? If you have too many prohibitions, you would receive an error message reporting that it is impossible for the designer to ensure connectivity across items in the study. If you have to prohibit a single item from appearing with more than half of the other items in the study, then this may be excessive. Again, we'd like to stress that it is much more important that the one-way frequencies be nearly balanced than to achieve approximate balance in the two-way frequency table.
(Note for advanced users: We were interested in the potential loss in design efficiency resulting from these nine prohibitions, so we performed a simple test. We assumed 250 respondents receiving this study as just designed versus the same study in which there were no prohibitions. The design with no prohibitions had perfect one-way balance, and nearly perfect two-way balance (low of 189 and high of 190 counts per two way cells). Upon estimating MNL parameters and studying the standard errors, we determined that the difference in overall design efficiency between these two designs was only 1%. For those familiar with conjoint analysis, the important point is that prohibitions are much less detrimental to MaxDiff designs than conjoint designs. That is because prohibitions in conjoint are within-concept whereas prohibitions in MaxDiff are between-concept. And, the nine prohibitions in MaxDiff eliminate a much smaller proportion of the full-factorial combinations than would nine prohibitions in a typical conjoint plan where each attribute has three to five levels.)
Finally, the report shows how often each item appears in the four positions within sets (top, bottom, etc.). This type of balance has no bearing on statistical design efficiency. But, balance here helps reduce psychological order effects (e.g. we wouldn't want a given item to always appear in the top position each time). The positional balance for our design is nearly perfect:
Positional Frequencies:
| Pos. 1 2 3 4
----------+-------------------------------------
Item 1| 300 300 300 300
2| 300 301 299 300
3| 300 300 300 300
4| 300 299 299 302
5| 301 299 300 300
6| 300 300 301 299
7| 300 300 300 300
8| 300 300 300 300
9| 300 301 299 300
10| 299 300 301 300
11| 300 299 301 300
12| 300 301 300 299
13| 301 300 300 299
14| 300 300 300 300
15| 300 300 301 299
16| 300 300 300 300
17| 300 300 300 300
18| 299 300 300 301
19| 300 300 300 300
20| 300 300 299 301
Mean = 300
Std Dev. = 0.59161
At this point, we have the basics programmed for this MaxDiff study. You can click OK to return to the Write Questionnaire dialog, where you'll see the twenty MaxDiff questions automatically inserted within your project:
Inserting the "Progress" and "Finish" Questions
When respondents have completed five MaxDiff questions, you had wanted to display a screen that says:
ProgressCounter:
Good work so far. We know that some of these tradeoffs are challenging.
We need to ask you to evaluate 15 more sets so that we can better determine how you make your reenlistment decision.
|
Insert a new Text question by highlighting the Page Break directly beneath the Reenlist_5 question, and then clicking Add.... Select Text as the question type and name the question ProgressCounter. Copy-and-paste the text for this question from this document and format the text into paragraphs. Preview the question to make sure it looks as expected. Click OK to return to the Write Questionnaire dialog, and insert another page break directly following this ProgressCounter question.
Last, we need to insert the final screen in which we tell respondents that they have completed the survey and link them to the Navy's official site.
Finish:
Thank you very much for your help. Your data will be used to help Navy planners as they work to make the Navy an even better career choice.
Click the Next button to finish submitting your data and to return to the Navy's official website. |
To do this, scroll to the bottom of the list of questions on the Write Questionnaire dialog. Highlight the final question in the list (Reenlist_20) and insert a page break. Then, click the Add... button and specify a Text question named Finish.
Copy-and-paste the text for this question from this document, implement any formatting you desire. Click OK to return to the Write Questionnaire dialog.
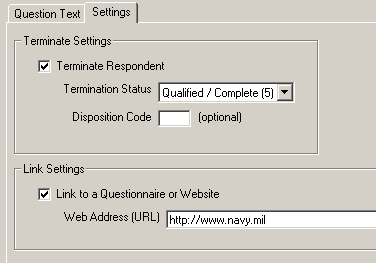
Next, insert a page break directly following the Finish question. Then, insert a new Terminate question directly following that entitled FinishLink. No text should be shown on this page. This page simply redirects respondents immediately to the Navy's website. While editing the FinishLink question, click the Settings tab. Note that by default the Terminate Respondent box is checked indicating that respondents seeing this page should be terminated and marked as completed records. Check the second Link to a Questionnaire or Website box and type within the provided field so that the respondent is sent to http://www.navy.mil. When you are finished, that dialog should look like:
Page Layout and Study Settings
It may be helpful at this point to review how Lighthouse Studio breaks the survey into separate pages, and some basic global settings that affect the look and functionality of your questionnaire. We also want to add a progress bar to our survey. The Write Questionnaire dialog also displays the page breaks that are currently set for your questionnaire.
Return to the Write Questionnaire dialog. This dialog shows how the various questions we've specified (or that Lighthouse Studio has automatically added to the list) are arranged across different pages. Page breaks are indicated by "---------------<Page>".
From the Write Questionnaire dialog, click the Survey Settings icon ![]() (alternatively, click Compose | Survey Settings...). This dialog controls global aspects of the questionnaire (meaning that the settings here control the general behavior of the questionnaire rather than page- or question-specific aspects.) Examples include the fonts and colors used in the questionnaire, the wording for the "Next" button, and the global header and footer that can appear at the top or bottom of each page of the survey. The details of this dialog are beyond the scope of this unit, but you can learn more about the items on the dialog by pressing the F1 key. However, we do wish to insert a progress bar. This is easily done by clicking the Progress Bar tab, and checking the Automatically show the progress bar box with the position selected as Page Footer (you'll note it is already checked by default).
(alternatively, click Compose | Survey Settings...). This dialog controls global aspects of the questionnaire (meaning that the settings here control the general behavior of the questionnaire rather than page- or question-specific aspects.) Examples include the fonts and colors used in the questionnaire, the wording for the "Next" button, and the global header and footer that can appear at the top or bottom of each page of the survey. The details of this dialog are beyond the scope of this unit, but you can learn more about the items on the dialog by pressing the F1 key. However, we do wish to insert a progress bar. This is easily done by clicking the Progress Bar tab, and checking the Automatically show the progress bar box with the position selected as Page Footer (you'll note it is already checked by default).
Save your changes and exit the Write Questionnaire dialog.
Adding Polish and Style
You have probably noted that the survey we've created is pretty bland looking. We can add some polish and style by clicking the Survey Settings icon ![]() from the Write Questionnaire dialog (or by clicking Compose | Survey Settings from the main menu).
from the Write Questionnaire dialog (or by clicking Compose | Survey Settings from the main menu).
First, let's select a style from the Styles tab. Select a style you wish to use, and click Use Selected at the bottom of the dialog to implement the style. We'll select Panama as the style, but you might want to experiment with other styles. Make sure to click the Use Selected box after selecting a style, to tell the software to actually use the style you have selected.
On the General Settings tab, you can select to use graphical Submit, Previous, and Select/Checkbox buttons. A library of buttons is provided, available in the C:\Program Files\Sawtooth Software\Lighthouse\graphics folder.
On the Headers and Footers tab, you can specify a Header and a Footer. We'll specify Reenlistment Questionnaire as the header text.
When you go back and test run the survey (From the Write Questionnaire dialog, Click the Test Survey button ![]() ) , your survey should have a bit more polish. Under Panama style, our survey now looks like:
) , your survey should have a bit more polish. Under Panama style, our survey now looks like:
Test Running Your Survey Using "Local Test Server"
Although the Preview Survey function is nice, you generally will want to test your survey in runtime mode, with any skip patterns, response verification, and randomizations in place. You could upload your files and the Perl scripts to the Web Server, but Lighthouse Studio provides a more convenient way to test run your survey locally on your PC or laptop.
When Lighthouse Studio was installed on your computer, web server software called "Apache" was also installed. Apache lets your computer run the questionnaire just like a remote Web Server would.
Local Test Server
From the Write Questionnaire dialog, Click the Test Survey button ![]() .
.
Your browser opens up the first survey page. This is your survey, as it would appear to a respondent over the Internet (there are slight visual differences from browser to browser).
To close the survey, simply close the browser window (using the X in the upper-right hand corner). To run the survey again, click the Test Survey button ![]() .
.
After you are convinced that the survey is functioning properly, you should also pretest your survey among your colleagues. They can give you feedback regarding the usability of the survey, and you can examine the resulting Counts data or perhaps even compute individual-level scores using the Analysis | Analysis Manager dialog (assuming you have enough data) to make sure the data at least have face validity.
At this point, you would set up the study typically using the hosting service provided by Sawtooth Software. You would invite the respondents to complete the survey (probably using an email message with a clickable link).
Data Management
Lighthouse Studio includes an Admin Module so that you can monitor or access your project from any computer connected to the Web. The Admin Module is password protected, and your passwords for access are specified on the Field | Hosting Management dialog. Lighthouse Studio generates random administrative access passwords whenever you create a new study, but you can modify them to suit your needs.
To download the data for our study, you would browse to the administrative module for your study on the web site (again, we are speaking hypothetically, as for this tutorial study there is no such site set up). Once at the Admin Module, you would download your data (by clicking Download from the main menu), making sure to save the data file to the same folder on your hard drive in which you developed the Lighthouse project. Alternatively, from the Lighthouse Studio interface, you can simply click Field | Data Management then Get Data to download your data without logging into the Admin Module.
Once you have downloaded the data, you are ready to analyze the data by Counting analysis (Analysis | Analysis Manager... and selecting Counts as the Analysis Type) or through more sophisticated methods such as latent class or hierarchical Bayes analysis also available on the Analysis Manager dialog..
Analysis: Counts and Computed Scores
At this point, we would like you to open the Tutorial study which contains hypothetical MaxDiff data for you to analyze. Click Help | Sample Studies | Sample MaxDiff.
We'll assume that you have collected data over the web and have downloaded the data to the folder on your hard drive containing the study files (as described in the previous section).
A quick summary method called "counts" is often used for summarizing respondents' preferences. Counting analysis simply looks at how many times an item was available within sets and counts how many times it was chosen either best or worst. The percent of times an item was chosen as best or worst (when it was available) is termed the "count proportion."
Run counting analysis for the tutorial data set by clicking Analysis | Analysis Manager... by choosing Counts as the Analysis Type and then by clicking Run. The MaxDiff Counts report is displayed:
MaxDiff Counts Analysis
MaxDiff Exercise Reenlist
Sets Included All
Respondents Included All respondents included
Total Number of Respondents 250
Total Number of Sets 5000
Times Times Best Times Worst
Item Shown- Selected Count Selected Count
Number Best Best Proportion Worst Proportion
3-year reenlistment obligation 1 999 310 0.310 177 0.177
5-year reenlistment obligation 2 1000 72 0.072 561 0.561
Location guarantee for next assi 3 999 191 0.191 286 0.286
Duty guarantee for next assignme 4 1000 202 0.202 283 0.283
Both location and duty guarantees 5 1000 361 0.361 135 0.135
Get promoted 6-months sooner than 6 1000 183 0.183 307 0.307
Live in 2-person barracks when in 7 1000 252 0.252 231 0.231
Live in 4-person barracks when in 8 1000 208 0.208 276 0.276
Choice between living in 2-person 9 1000 294 0.294 186 0.186
$50 per month pay increase when o 10 1000 230 0.230 271 0.271
$75 per month pay increase when o 11 1000 246 0.246 225 0.225
Half of on-job time using your sk 12 1001 185 0.185 311 0.311
Three-quarters of on-job time usi 13 1001 199 0.199 251 0.251
Time off each week allowed for on 14 1000 190 0.190 309 0.309
Receive online career counseling 15 1000 234 0.234 268 0.268
Receive in-person personal counse 16 1001 231 0.231 238 0.238
Receive phone-based personal coun 17 1000 195 0.195 279 0.279
Current reenlistment bonus ($2,50 18 1000 276 0.276 189 0.189
Increased reenlistment bonus ($5, 19 999 386 0.386 110 0.110
Increased reenlistment bonus ($10 20 1000 555 0.555 107 0.107
The report shows results for 250 respondents and 5000 sets (remember, each respondent received 20 choice sets; 250 x 20 = 5000). You may recall that we had originally generated 300 questionnaire versions for respondents to potentially complete. We only interviewed 250 respondents, so not all questionnaire versions were used (which isn't a concern, since each questionnaire version independently has excellent qualities). However, we see from the "Number of Times Shown" column that each item was shown almost exactly the same number of times. In the "Times Selected Best" column, we see how many times each item was selected best (across all sets and respondents). Dividing the "Times Selected Best" by the "Times Shown Best" results in the "Best Count Proportion." The higher the proportion, the more impact this item has on reenlistment.
Counts proportions are a good way to get a quick (top-line) look at the data. This method of analysis is very intuitive. But, we don't suggest you use counts results in final reporting. Because of prohibitions in your design or slight imbalances, the data are not as accurate as when using logit, latent class, or HB estimation routines, all automatically provided under Analysis | Analysis Manager....
The item selected best most often was "Increased reenlistment bonus ($10,000)." Thus, we can see that these sailors (at least our hypothetical ones) pay most attention to monetary rewards. Even the $5,000 reenlistment bonus tends to trump every other issue. If you are interested, you can also examine the proportion of respondents choosing each item as worst. This data set was generated with artificial symmetric properties, so there is no difference between bests and worsts other than random noise. However, this isn't always the case with real data sets, where respondents may not use a consistent scoring approach when judging bests and worsts.
Let's turn our attention to a more powerful and accurate method of analysis: hierarchical Bayes (HB). A typical data set may take about 10 to 15 minutes to run using HB (very large data sets may take hours). HB estimates a set of scores for each respondent. These scores may be saved to an Excel-compatible file. How HB actually works is beyond the scope of this tutorial and we refer you to technical papers on HB on our website, www.sawtoothsoftware.com.
Click Analysis | Analysis Manager... then select HB as the Analysis Type, then click Run. First, the software reads the data set and prepares it in a more compact way for more efficient processing. As part of this step, the software reports how many respondents it has found and how many times items were chosen in each position of the question.
** Data Summary **
Total respondents = 250
Total 'Best' choices = 5000
Total 'Worst' choices = 5000
Average sets per respondent = 20.00
'Best' responses by position:
(1) 24.38%
(2) 26.34%
(3) 25.08%
(4) 24.20%
'Worst' responses by position:
(1) 24.76%
(2) 25.28%
(3) 24.78%
(4) 25.18%
Click Estimate Scores to continue. HB uses an iterative process that takes 1000s of iterations to converge on a stable solution. By default, the first 20,000 iterations are called "burn-in" iterations that are discarded as iterations prior to obtaining convergence. The last 10,000 by default are called the "used" iterations and are averaged to produce individual-level scores for your MaxDiff items.
Partway through the estimation, the MaxDiff Score Estimation dialog may look something like this:
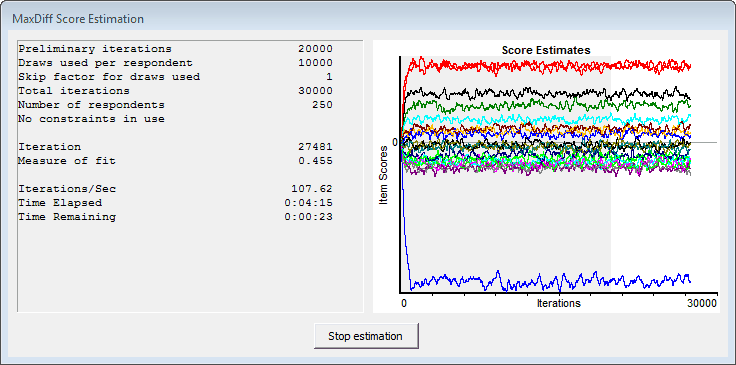
This display shows how well the estimated scores are stabilizing over the planned thousands of iterations. The graphic plots the estimated scores at each iteration of the process. The estimates first all start at 0, and then trend toward their final values (which may be either negative or positive). Once the process has "converged" the estimates will tend to randomly "wobble" up and down, but there should be no noticeable trend remaining.
The graphic is divided into two regions: a gray region (iterations prior to assumed convergence) and a white region (iterations after assumed convergence). Once the iterations cross into the white region, you should look for no noticeable trend in the data. The plotted scores should just continue to wobble randomly up and down, with no strong and sustained move in any specific direction. If there is noticeable trend after the plotted values are in the white region of the graphic, then you should repeat the estimation using more iterations (under the Advanced button).
(Note that for sake of brevity we didn't include "constraints" in this estimation to force the scores for some items to be higher than others, such as $10,000 bonus higher than $5,000 bonus. You do not need to enforce such constraints during estimation, though some researchers choose to do so.)
When the estimation finishes, the graphical plot of the estimation remains on the screen. Click the button stating: The estimation is complete. Click here to close.
When you click the "close" button, a report is given which resembles a spreadsheet, with multiple "sheets" that can be accessed by clicking the tabs at the bottom of the dialog labeled "Summary," "Settings Summary," "Probability Scale," "Zero-Anchored Interval Scale," and "Zero-Centered Raw Scores." The first (Summary) sheet contains a summary of the final scores, 95% confidence intervals,and other information regarding the settings for your run:
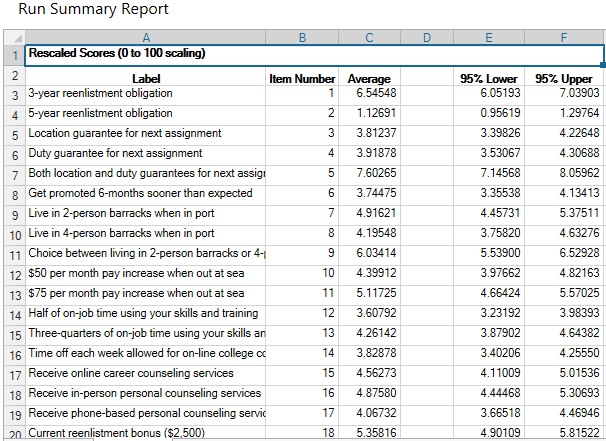
This is a summary report averaged across all respondents in the analysis. Note that the output has multiple tabs that you can click to access. The third (Probability Scale) and fourth (Zero-Anchored Interval Scale) sheets contain the scores for each respondent, including a fit statistic. Most researchers will pay most attention to the Probability Scale scores as they are easiest to interpret and present to others. These individual-level item scores are positive values ranging from 0 to 100 that sum to 100. This approach has the valuable property of ratio-scaling. That is to say, an item with a score of 20 is twice as important (or preferred) as an item with a score of 10.
Respondents who answer randomly will generally have low fit statistics. We have provided guidelines (fit statistic thresholds) for identifying "bad" respondents elsewhere in this documentation. You can use the suggested cutoff rules to discard respondents that are most likely answering randomly.
You may click the Save Report icon to save this report to an Excel format.