Counting Analysis
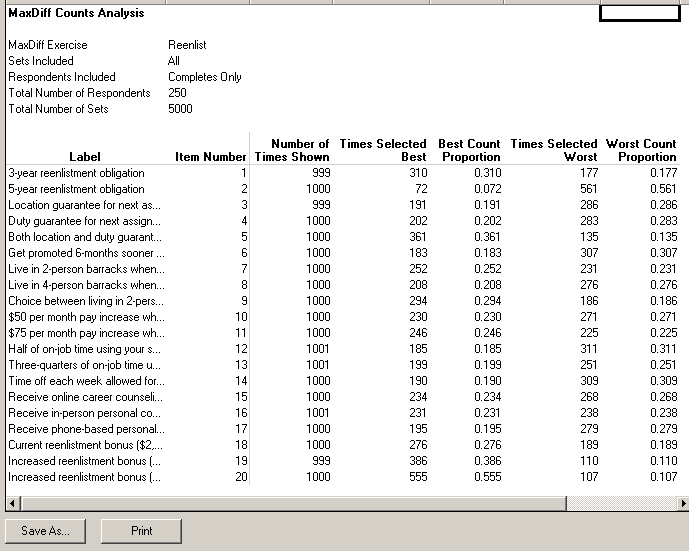
Counting analysis takes into account how often each item was available for choice, and how many times it was selected as best or worst. We divide the number of times each item was chosen by the number of times it was displayed to the respondents (and available for choice). Intuitively, we are asking: "When an item is available within a set, what is the probability that respondents select it as best or worst?" To obtain this analysis, you first must have downloaded the data from your web server. Then, click Analysis | Analysis Manager, select Counts as the Analysis Type and then click Run.
Here is an example of the output:

These "counts proportions" do not add to 100% (since all items were not displayed in each set). But if you would like, you may copy-and-paste the values into Excel and re-scale them to sum to 100. The interpretation is the same irrespective of the scale.
If your experiment is perfectly balanced (each item displayed an equal number of times, and each pair of items shown together an equal number of times, etc.) then the results should closely resemble what is produced by the most sophisticated analysis method provided by MaxDiff, described in the next section.
Other options in the area include:
Sets to Include
Clicking Sets to Include area accesses a dialog in which you can specify which sets to include. Most users will utilize all sets within analysis. However, there may be instances in which advanced users wish to use only a subset of the full data.