Introduction
Sensitivity analysis refers to running a simulation scenario multiple times and observing the change in share of preference due to changing product specifications. A typical sensitivity run changes the price for one of the products in the simulation scenario and shows you how those changes to price affect the share of preference for that product (holding all other products in the simulation scenario constant).
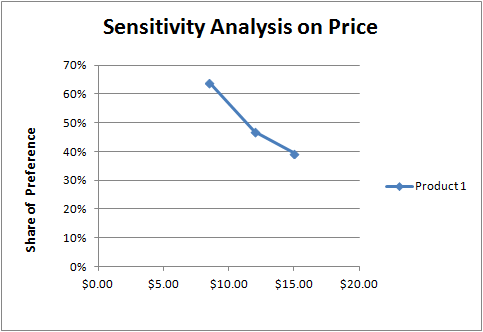
For example, we might put three products in the market simulation scenario and run a sensitivity analysis varying the levels of price for just Product 1 (holding the other products constant). If the price attribute had just three price levels ($8.50, $12.00, and $15.00), the results of the sensitivity analysis might look like:
$8.50 |
$12.00 |
$15.00 |
|
Product 1 |
63.87% |
46.94% |
39.49% |
If we use a program like Excel to plot the results, we see the sensitivity of Product 1's shares to changes in price (holding all other products constant):
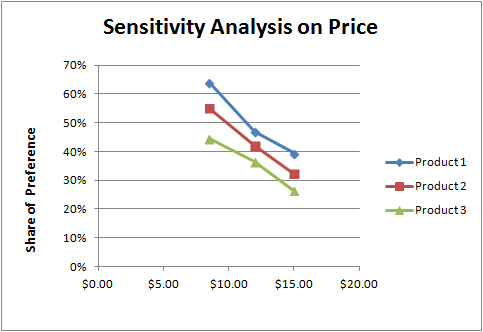
We could ask the sensitivity analysis to vary the prices for all three products in the simulator, one at a time, holding the other two products constant at $12.00. The results might look like:
$8.50 |
$12.00 |
$15.00 |
|
Product 1 |
63.87% |
46.94% |
39.49% |
Product 2 |
55.06% |
42.09% |
32.32% |
Product 3 |
44.32% |
36.34% |
26.50% |
And if we plotted those results using Excel, we would see a chart like the following:
Sensitivity analysis can be run on attributes other than price. In fact, sensitivity analysis can be a very good way to communicate to others the affect of all attribute levels on the choice likelihood for a given product placed in a competitive market scenario. For example, in our book, "Getting Started with Conjoint Analysis," we show how sensitivity analysis can be used to see how the share of preference for a client's product concept (within a competitive market scenario) changes due to modification to all attributes (other than brand, since the client of course cannot change its brand).
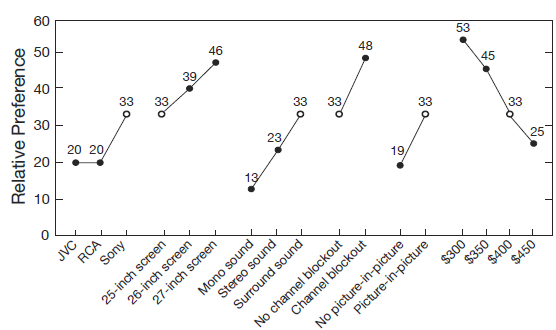
Source: "Getting Started with Conjoint Analysis," 2014, third edition, Research Publisher's Inc.
In the example above, the client's product is {Sony, 25-inch screen, Surround Sound, No channel blockout, Picture-in-picture, $400}--all the levels represented by hollow markers at 33% share of preference. When that product is placed in competition with others, it achieves a 33% share of preference. Sensitivity analysis investigates the share of preference for that specific Sony product if it makes changes (one attribute at a time) across each of the levels included in the study. This shows the share of preference effect of all the attribute levels on a specific Sony product specification, given the specific context of realistic competition. This is a much more effective and useful way to show managers conjoint analysis results rather than showing the average part-worth utilities across the population. (Note: although it isn't possible for Sony to change its brand to JVC or RCA, this chart nonetheless shows Sony the value of its brand; because if the product were branded JVC or RCA, the share of preference would fall from 33 to 20).
How to Conduct Sensitivity Analysis
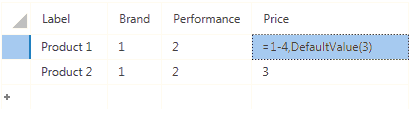
To conduct sensitivity analysis, instead of specifying that a product have a specific level of an attribute, you use a Range or the Range function.
Entering a range of =1-4 will run sensitivity on levels 1 through 4. Entering =1,4 will run sensitivity only on levels 1 and 4. Entering =1-3,7-10 will run sensitivity on levels 1, 2, 3, 7, 8, 9 and 10.
Because the cell contains a range, there is no single value to use when doing sensitivity on another product or attribute. The value to be used in this case is called the default value. Unless explicitly specified, the default value will be assumed to be the first level of the attribute. However, the default value can be specified using the DefaultValue() function.
In our example where the range is =1-4, the default is assumed to be level 1. However, if we wanted price level 3 to be the default value, we would simply specify =1-4,DefaultValue(3).
(Do a similar specification for any other attributes for any products to be varied in the sensitivity analysis.)
An alternate way to specify a range is to use the Range() function. This function takes a minimum and maximum value, and as an option you can additionally specify an increment and/or a default value. The syntax for the function is:
=Range(start, end, [increment], [default]) (The brackets around increment and default denote that those are optional fields.)
The formula =Range(1,4) would have the same result as entering =1-4.
Oftentimes you may want to specify prices that fall between levels used in the questionnaire (interpolation). For illustration, this time we'll assume that you have assigned price values (100, 200, 300) to correspond to price levels 1, 2, 3. Perhaps you want to see sensitivity results for a product initially specified at base price $200, at increments of $25. You would specify in the price cell the Range instruction: =Range(100, 300, 25, 200). This would mean run sensitivity for prices between $100 and $300, at $25 increments and to use a value of $200 when sensitivity is being performed on another product or attribute. The resulting values used in the sensitivity would be $100, $125, $150, $175, $200, $225, $250, $275, and $300.
Note, if your regional settings are for a country that uses the comma to define the decimal place and semicolon to the separator, then the appropriate syntax would be =100;300 or =Range(100; 300; 25; 200).
Sensitivity Mode
When you click the Sensitivity as the Range Behavior, then click the settings icon ![]() (in the Simulation Settings ribbon group on the My Scenario Settings tab), you can choose from three sensitivity modes:
(in the Simulation Settings ribbon group on the My Scenario Settings tab), you can choose from three sensitivity modes:
•Sequential the attributes with Range specifications are varied one at a time across their levels, holding the specifications for all other products constant
•Parallel may only be used if two or more products include Range specifications for attributes. All products that involve range specifications for a given attribute are changed in parallel across the attribute.
•Exhaustive may only be used if one product with more than one attribute having a Range specification or multiple products each having just one attribute with a Range specification is specified. All possible combinations of the attribute changes are simulated.