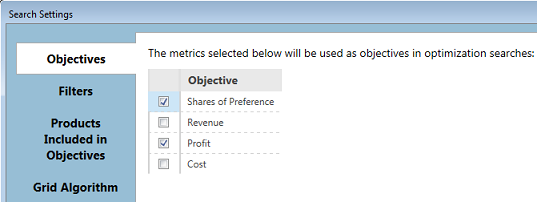
Often times a firm is interested in products and product line extensions that lead to good performance on multiple objectives, such as:
•Share of Preference
•Revenue
•Profit
•Costs (minimizing)
Often these goals tend to conflict, such as maximizing share of preference and minimizing costs. But multi-objective searches allow you to find solutions that offer the best tradeoffs among multiple objectives; for example, a solution that offers a very good level of profitability with a very good share of preference.
Genetic Algorithm and Exhaustive search are the two search algorithms you can use for multi-objective searches in the ASM.
Consider the following two-way scatter plot of market simulation solutions in terms of Profit on the X-axis and Share of Preference on the Y-Axis:
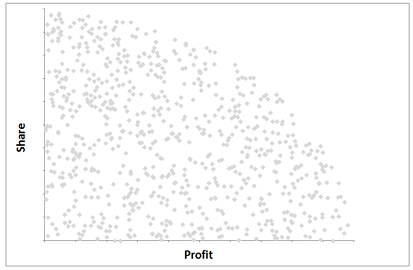
Each of the points on the plot represents a product concept's performance (or multiple searched products in the case of a line extension) compared to a set of fixed competitors within a market simulation scenario.
The firm would prefer solutions that maximize share of preference while also maximizing profit. But, there is a real-world tradeoff, since maximizing share of preference by offering excellent products at the lowest possible prices would tend to harm profitability.
Those solutions that are furthest upward and to the right would seem to offer the best opportunities for the firm to reach its goals, depending on which was more important to the firm: share or profit. These best solutions represent what is called the efficient frontier of opportunities:
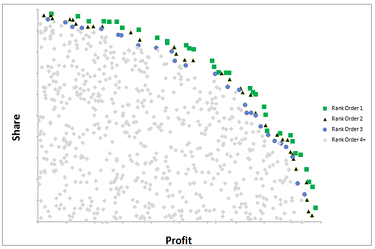
The solutions indicated by green squares are those that offer the best tradeoffs (compared to the other solutions) on both share and profitability. They are Rank Order 1 of Domination solutions, meaning that no other solution is better (or equal) to them on both dimensions. Rank Order 2 of Domination solutions are those who are bettered (or equaled) by just one other solution on both dimensions.
You can conduct a multi-objective search on two or more goals if using Exhaustive or Genetic search. On the My Scenario Settings tab, select either Search - Exhaustive or Search - Genetic as the Range Behavior. click the ![]() icon for Range Behavior and then click multiple goals from the Objectives dialog.
icon for Range Behavior and then click multiple goals from the Objectives dialog.
We'll run a multi-objective search using the Exhaustive algorithm to maximize Shares of Preference and Profits using the profit search example from Example #4. (To keep things running quickly, we'll use the First Choice simulation method and we will not do any interpolation steps for price. We'll restrict one of RCA's products to be priced either at $300 or $350; and the other at either $400 or $450).
By default, the software retains the top 100 solutions that have the most favorable rank order of domination (you may change this default). It lists those top 100 solutions for you in a grid, but it also displays the solutions graphically:
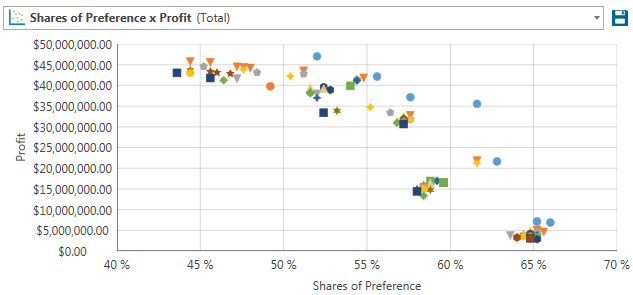
The solutions indicated by the blue dots (furthest up and to the right) are the Rank Order #1 Domination solutions. No other solutions can beat or match these on both Share of Preference and Profit. Orange triangles represent Rank Order #2 solutions. If you hover your mouse pointer over any of these markers on the graphic, a pop-up box indicates its result # so that you can further investigate the composition of this product (its attributes and levels) and other details in the grid report.
For example, imagine you were interested in learning more about the search solution indicated by the blue pointer below:
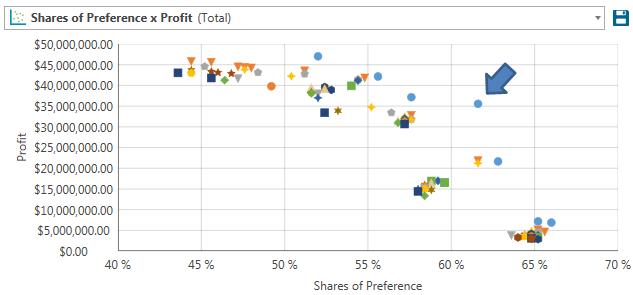
When you hover your mouse directly above that marker on the graphic, a pop-up message box gives some basic information about it:
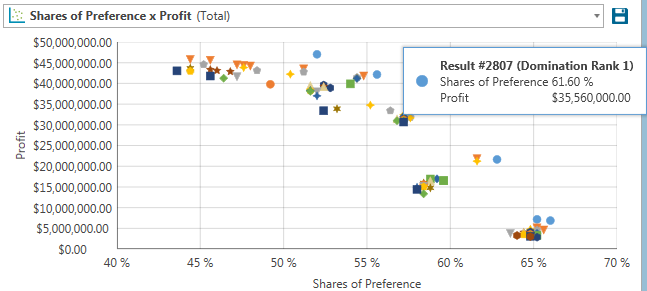
This solution we hovered over on the graphic is Result #2807 and it has a share of preference of 61.60% with profit of $36K. The top 100 solutions found are first summarized and then listed in more detail further below in the grid report that the ASM also has prepared for you.
If we scroll down the grid report until we see the details for Result #2807, we see the following:
Product Search Result #20421 (Domination Rank 1) |
|
|
|
|
||||
Label |
Shares of Preference |
Profit |
Brand |
Screen Size |
Sound Quality |
Channel Blockout |
PIP |
Price |
Product 1 |
1.60% |
$4,800,000.00 |
JVC |
25" screen |
Mono sound |
No channel blockout |
No picture in picture |
$300 |
Product 2 |
2.00% |
$5,800,000.00 |
JVC |
26" screen |
Stereo sound |
Channel blockout |
No picture in picture |
$350 |
Product 3 |
14.80% |
$40,700,000.00 |
Sony |
26" screen |
Stereo sound |
No channel blockout |
Picture in picture |
$350 |
Product 4 |
20.00% |
$66,000,000.00 |
Sony |
27" screen |
Surround sound |
Channel blockout |
Picture in picture |
$450 |
Product 5 |
37.20% |
$11,160,000.00 |
RCA |
26" screen |
Stereo sound |
Channel blockout |
Picture in picture |
$300 |
Product 6 |
24.40% |
$24,400,000.00 |
RCA |
27" screen |
Surround sound |
Channel blockout |
Picture in picture |
$400 |
This was a multi-product search, with the two searched RCA products shown in italics. Their net share of preference is 37.20% + 24.40% = 61.60%. Their net profit is $11,160,000 + $24,400,000 = $35,560,000. This solution seems to offer a good balance between capturing a high share of preference while also being relatively profitable.
If we repeated the search and allowed the prices to vary over a greater number of interpolated step values between $300 and $450, we could obtain solutions that were potentially slightly better than the one shown above.