The Data Reports area lets you run frequency tabulations (including cross-tabulations and charts) of the data in real-time by browsing to and logging into the Online Administrative Module. You can analyze complete and/or incomplete records.
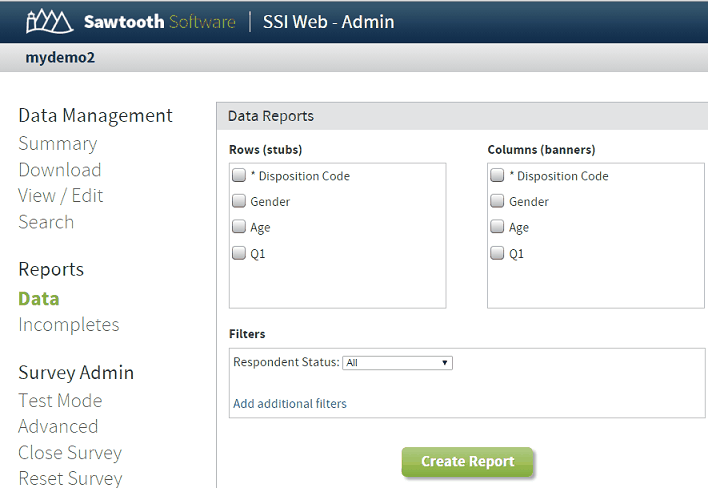
Rows (stubs) These are the questions you are tabulating.
Columns (banners) If you want the results for your Row variables to be split out by respondent subgroups (as separate columns), specify the filtering variables here.
| Filters | Here you specify whether you want to tabulate results for All Respondents, Qualified/Completes Only, Incomplete, or Disqualified. |
| Add additional filters | You can specify additional filters, so results are tabulated only for a subset of respondents. |
Click Create Report to run the tabulation.
Tabulations for Numeric/Single Select Questions
Tabulation reports for Numeric and Single select questions are quite similar, since each question contains a single response. Here is an example for the question age, for just ten respondents:
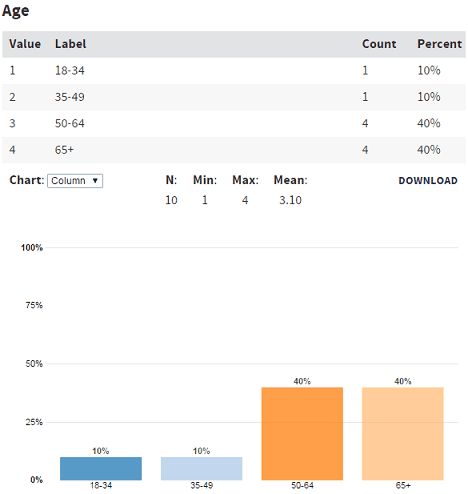
The Value column shows the values that were recorded in the data. The Label column displays the label used for each response category (if applicable). Count shows how many respondents used each unique value. Percent shows the percentage of respondents (who answered the question) that used each value. Finally, the N (total number of respondents that answered the question), Min (minimum value used), Max (maximum value used), and Mean (average of values used).
Note: You can download the data for any table in this report to a .csv file by clicking the Download link.
Data Reports for Multiple Select Questions
Consider the following question:
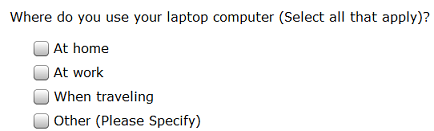
The Data Report for this question may look like:
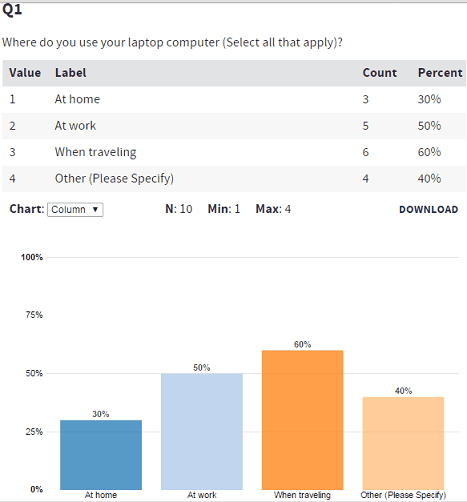
With select-type questions, a Label column shows the text associated with each value for this question. The Count column shows that a total of 3 + 5 + 6 + 4 = 18 responses were provided by the 10 respondents who received this question. The percents are percents of respondents (30% of respondents said they use their laptops at home) rather than percents based on total responses given. As a result, the percents for multi-select questions will not usually sum to 100%.
Please note that all respondents who saw this question and submitted the corresponding page are counted in the base for multiple response questions, even if they did not check any of the boxes.
Saving Report Specifications
You can save report settings so that you can run them again at a later point. Please note that only the settings are saved. Each time the saved report runs, it will be applied to any data currently in the study.
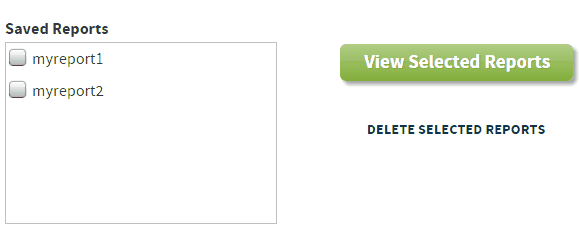
When you save a report, the next time you open the Data area, you are shown a list of existing reports to select from:
Notes:
Grid Questions: Multiple-response check-box questions within grids are available for tabulation. The variable for a row-based question is listed using the convention grid_r1_c* where the asterisk means that check boxes across all columns for the question in row1 will be tabulated. The convention for column-based questions is grid_r*_c1 where the asterisk means that check boxes across all rows for the question in column1 will be tabulated.