Single-goal search optimizations don't always provide the strategic information to best guide a firm's decisions. For example, optimizing share of preference may mean selling superior capability products at such a low price as to lose money on each unit sold. On the other hand, profit-maximizing solutions may lead to stiff losses in share of preference that are not compatible with the firm's long-term strategy. In many cases, it would be better to find a solution that near-optimizes profit while also leading to relatively high share of preference outcomes.
Our Exhaustive and Genetic search algorithms allow you to conduct multi-objective searches, where the objectives can include any combination of share of preference, revenue, profit, or cost. The latter three goals require that price be included as an attribute in the study. To specify a multi-objective search, From the My Scenario Settings tab, select Search (Exhaustive) or Search (Genetic) as the Range Behavior click the ![]() (settings) icon and on the Objectives dialog, check multiple objectives (Shares of Preference, Revenue, Profit, or Cost).
(settings) icon and on the Objectives dialog, check multiple objectives (Shares of Preference, Revenue, Profit, or Cost).
Our implementation of multi-objective searches was inspired by Scott Ferguson's presentation at the 2013 Sawtooth Software conference and made possible by later interactions with Scott who helped us refine our algorithms.
Domination Rank
The domination rank of solutions is reported when you specify a multi-objective search (when you check multiple objectives as the search criteria).
Lower ranks are better. A solution has domination rank 1 if no other solutions are either equal to or better than it on all of the search objectives. To illustrate, the graphic below shows four possible solutions (A-D) plotted in terms of Profit on the X-axis and Share of Preference on the Y-axis.
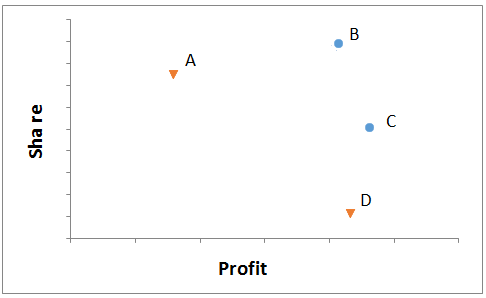
Solution B has both higher share and higher profit than solution A. Thus, A is dominated by solution B on both dimensions. Solution C has higher profit than solution B, but lower share. Neither B nor C is dominated (or equaled) on both dimensions by any other solution. Thus, the Pareto efficient frontier of non-dominated solutions is defined by the set indicated by blue markers {B, C}. We call solutions B and C rank order 1 solutions, because they are dominated by no other solutions. The set {A, D} indicated by orange markers are rank order 2 solutions, because they each are dominated by exactly one other solution. Rank-order 3 solutions are dominated by exactly 2 other solutions, etc. We compute the rank-order for all solutions in this manner and remove any ranks that have no solutions (renumbering the ranks from 1 to n in successive integers).
Consider a multi-objective search for which we asked the software to report the top 50 solutions. A graphic is reported where solutions of the same rank order are labeled with a common marker and color. The blue circles in this graphic are rank order one solutions.
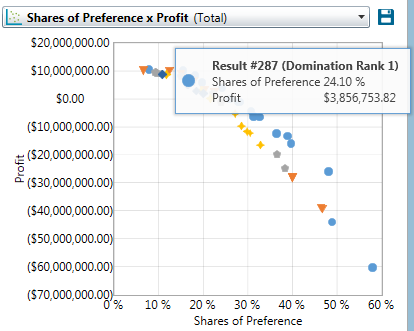
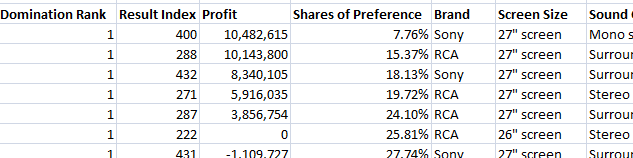
If you hover your pointer over a marker, the solution number (Result #287 in the example above) is reported so you can investigate the details (e.g. attribute level composition) of that solution in the table report. In the table below, you see the metrics and attribute composition of Result Index #287 (the fifth result listed in the report).